WINGX�s weekly Business Aviation Bulletin.
Summary
The first quarter of 2023 has shown a modest cooling compared to record-breaking Q1 2022, although the sharper decline in the US charter market has eroded a substantial amount of the gains compared to pre-pandemic 2019. European bizjet gains compared to 2019 have narrowed to 5%. There is still some record-breaking growth in large cabin long-sector flying. Bizjet activity in the UAE has more than doubled versus Q1 2019.
Global
Worldwide business jet sectors in Week 12 of 2023, March 20th through 26th, amounted to 68,543 sectors, a 3% decrease compared to week 11 2023, a 9% decrease compared with the same dates in 2022. The global trend for the last 4 weeks is 8% behind the same dates in 2022. Global Part135 and Part91K bizjet activity in week 12 was 17% below the same dates last year.
Between March 1st – 27th business jet and turboprop activity amounted to just over 393,000 sectors, 7% fewer than the same 27 days in March 2022, still 9% ahead of 2019. Year to date (Jan 1st � March 27st), business jet and turboprop activity is 2% behind last year, although 12% ahead of 2019. Focussing just on business jet activity so far this month, flight sectors are 8% down compared to last year, still 14% ahead of 2019.
Chart 1: Global fixed wing flights, March 1st � 27th 2023 compared to previous years. (Note business aviation includes turboprops)
North America
In Week 12, 53,520 bizjet sectors departed North American airports, 2% less than Week 11, 11% fewer than the same dates last year. In the last four weeks activity is 10% below the same dates last year. Part135 and Part 91K activity during week 12 was down 5% compared to week 11, 17% below the same dates in 2022.
Business jet departures from North America are down 10% so far this March compared to comparable 2022, 13% above comparable 2019. Year-to-date bizjet sectors are down 5% compared to last year, 13% above 2019. Year-to-date international bizjet connections are up 2% compared to last year, 9% ahead of 2019. Domestic flights, which account for 88% of flights this year are down 6% compared to last year, 14% ahead of 2019.
Domestic bizjet flights are down 7% so far this year in the United States compared to last year, 17% ahead of 2019. The average sector length of domestic US bizjet flights this year is 1.57 hours, Teterboro the busiest departure airport. Teterboro � Palm Beach is the busiest domestic airport pair so far this year, the Bombardier Challenger 300/350 is the busiest aircraft.
Chart 2: US Domestic Bizjet flights by operator type, January 1st � March 27th 2023 compared to previous years.

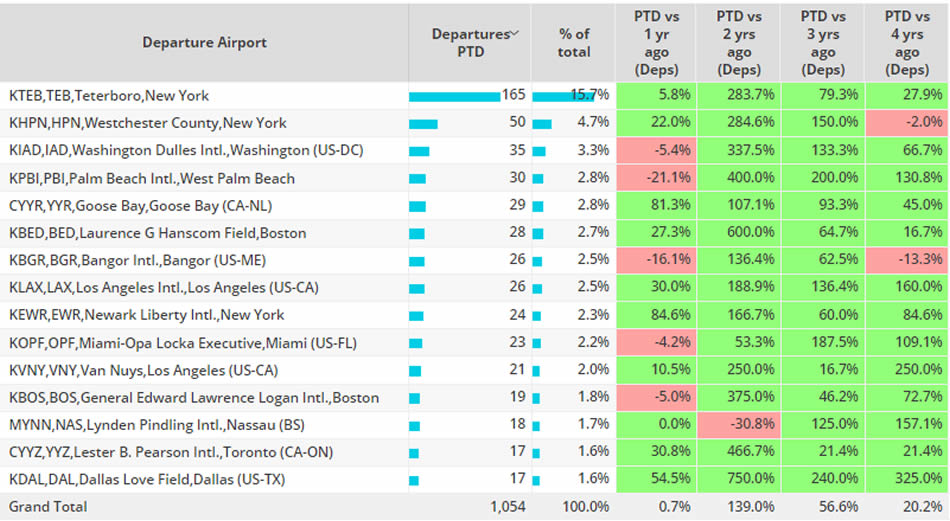
Trans-Atlantic bizjet sectors (North America � Europe), so far this March are up 1% compared to comparable 2022, 20% ahead of 2019. With over 100 more Trans-Atlantic departures than the second ranked airport, Teterboro is the busiest departure point, Trans-Atlantic departures are up 6% compared to March 2022, 28% ahead of March 2019.
Chart 3: Trans-Atlantic Business Jet departure airports March 1st � 27th 2023 compared to previous years.
Europe
In Europe, 9,632 bizjet sectors were flown in week 12, 4% less than in week 11, 8% fewer than the same dates in 2022. In the last four weeks activity is 8% below the same dates in 2022.
Business jet sectors so far this year are down 8% compared to last year, 5% above 2019. Excluding Russia and the YTD trend is 5% behind last year, 8% ahead of 2019. 65% of bizjet flights this year have been less than 90 minutes in duration, sectors under 90 minutes are down 4% compared to last year, 5% ahead of 2019. Ultra-long haul (12 hours+) flights are up 12% compared to YTD 2022, triple digit growth compared to 2019.
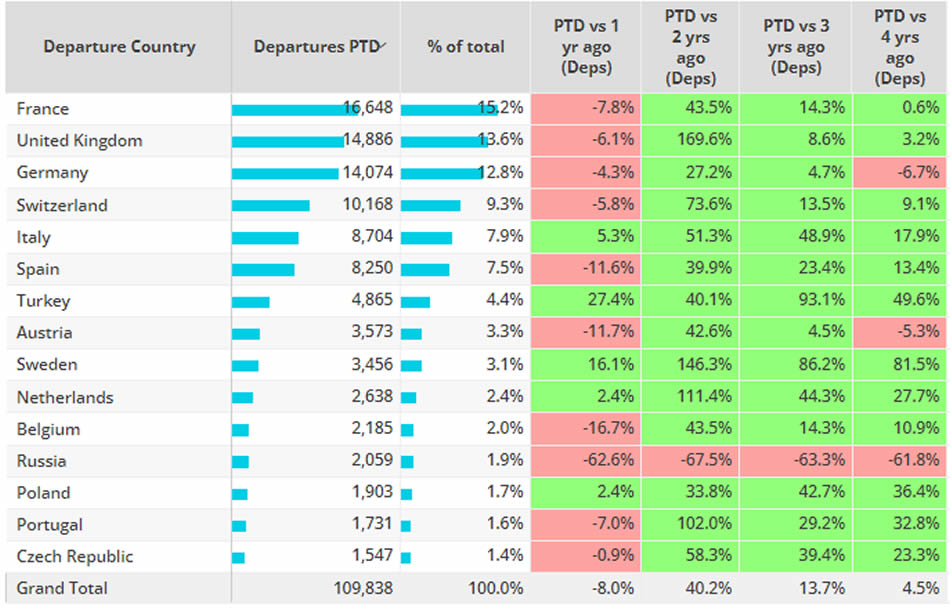
YTD the top markets are seeing declines compared to last year. Bizjet departures from airports in France, the busiest market in Europe, are 8% behind last year. UK bizjet departures are down 6% versus Q1 2022. Germany has seen sectors fall 4% behind for the same period, which takes activity 7% down on Q1 2019. Departures from Russia are down 63% compared to last year, 62% down compared to 2019.
Chart 4: European Bizjet Markets, January 1st � March 27th 2023 compared to previous years.
Rest of World
In Week 12 of 2023, March 20th through March 26th, activity in Africa was down 9% compared with the same dates last year, Asia up 3%, Middle East down 13% and South America up 20%.
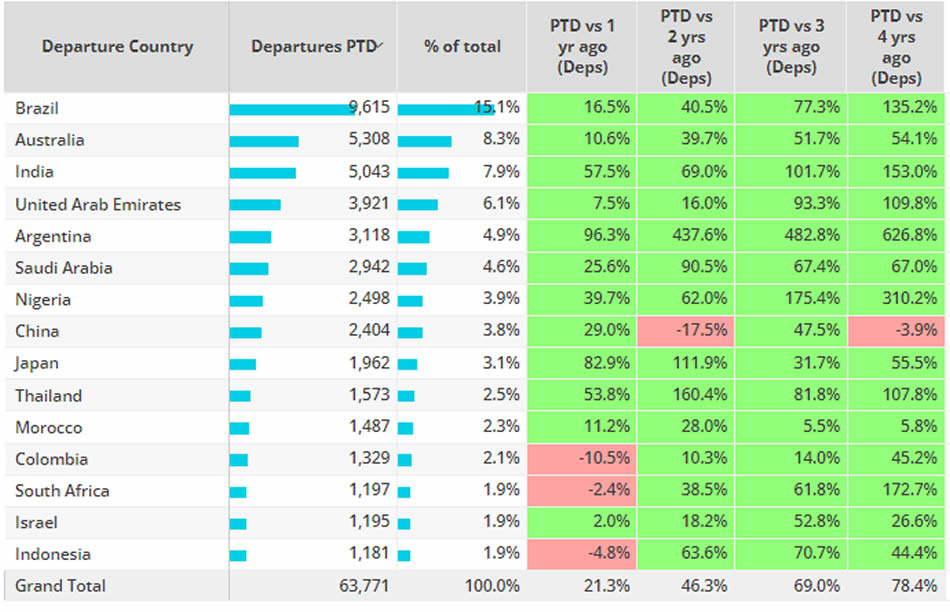
In the Rest of World region there have been just under 64,000 business jet sectors so far this year, 21% more than 2022, 78% more than 2019. Brazil is the busiest market, sectors are 17% ahead of last year, triple digit growth ] compared to 2019. India, United Arab Emirates and Argentina are experiencing triple digit growth compared to 2019. In contrast, tracked bizjet activity in China is down 4% compared to 2019.
Chart 5: Top Rest of World bizjet markets, 1st January 2023 � 27th March 2023, compared to previous years.