WINGX�s weekly Business Aviation Bulletin.
Summary
In the US, bizjet demand was well down in the last week due to the July Fourth holidays, with the 4-week trends confirming around 5% deficit on last year´s record activity. Much fewer transatlantic trips so far in July, but still up 20% on pre-covid. European trends are mixed, with Central Europe falling below 2019 levels, but hotspot holiday locations still seeing record arrivals.
Global
During the opening 9 days of July, global business jet and turboprop sectors are trending 7% behind the first 9 days in July 2022, 9% ahead of 2019. Focusing on just business jets, activity dropped 8% below July last year, 15% ahead of 2019. Year to date (1st January – 9th July), business jet activity is 5% down on 2022, although 19% ahead of 2019.
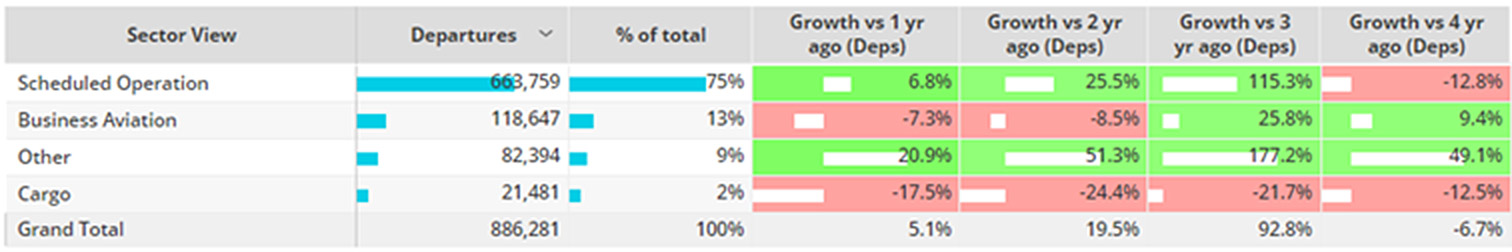
So far this month, scheduled airline activity rebounded 7% ahead of last year, still 13% behind 2019. The top 5 busiest airlines (Southwest Airlines, American Airlines, Delta Airlines, Ryanair, United Airlines) are operating 9% more sectors compared to July last year, 9% ahead of July 2019.
Chart 1: Global fixed wing flights by sector, July 2023 compared to previous years (Note business aviation includes turboprops)
North America
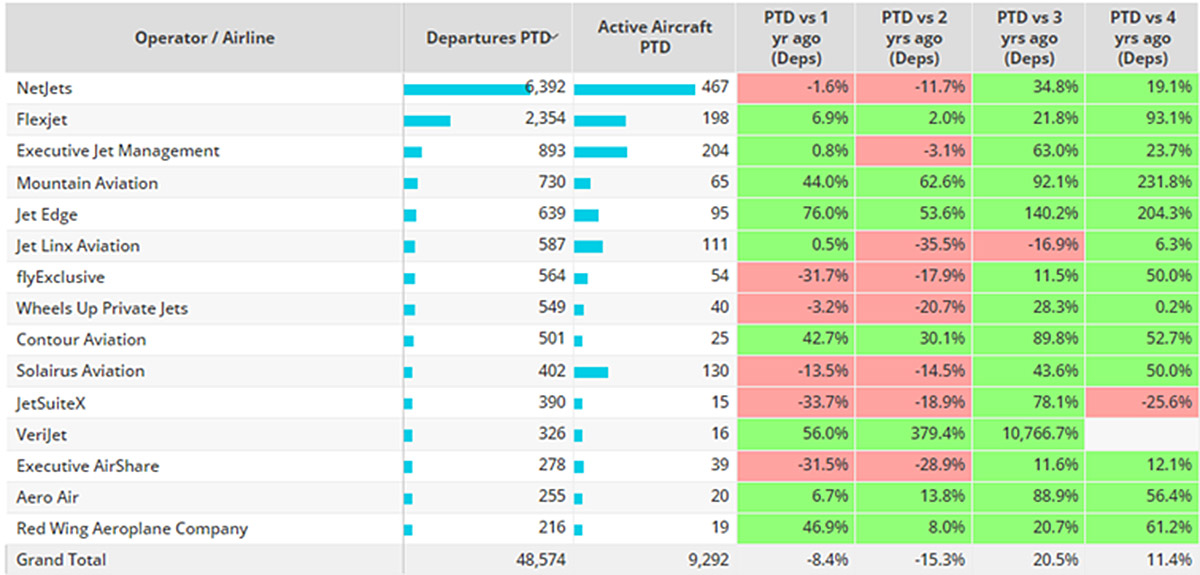
Business jet activity in North America in week 27 2023 (3rd-9th July) was 5% below the same dates in 2022, and saw a typical holiday-trend of 26% less traffic than week 26. The 4-week trend for 2023 trails comparable traffic last year by 4%. Since January 1st there have been 1.4 million bizjet sectors operated across North America, departures down 6% compared to the same period last year, although 18% ahead of 2019. New York is the city with most airport departures in business jets, with metro-related activity down 11% on July 2022. NetJets is the busiest operator in the US this month, sectors 2% behind last year, 19% ahead of 2019. Teterboro is the busiest single airport, departures still trailing 2019, down 9% for the first few days of July. The other busiest airports this month � Dallas Love Field, Las Vegas McCarran, Van Nuys and John Wayne Orange County � are all seeing at least 10% declines in bizjet activity compared to last year.
Chart 2: Busiest Business Jet Operators in the US, July 2023 compared to previous years.
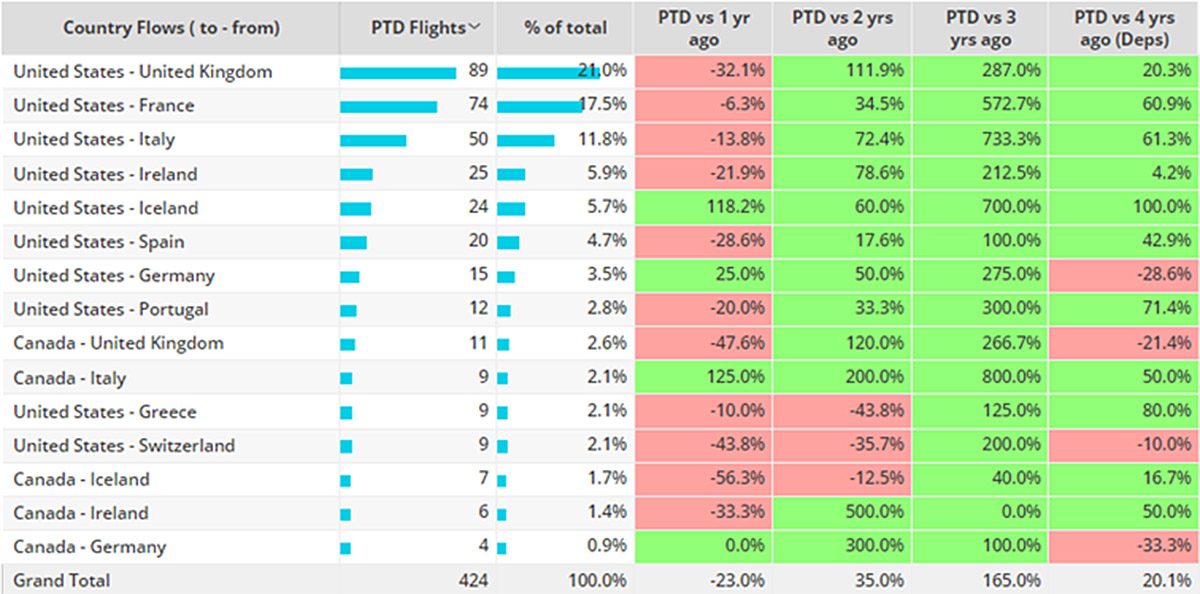
Year to date, Trans-Atlantic business jet sectors are on par with last year, 17% ahead of 2019. Departures from Teterboro to Luton down 13% compared to YTD 2022, contrast Teterboro to Biggin Hill where departures are up 26% compared to YTD 2022. So far this month, trans-Atlantic business jet sectors are 23% behind comparable July last year, 20% ahead of 2019. Demand between the United States � United Kingdom, the busiest country flow, has fallen by double digit figures compared to last year. Notably, US � Iceland connections seeing triple digit growth compared to last July.
Chart 3: Trans-Atlantic (North America � Europe), business jet country flows 1st � 9th July 2023
Europe
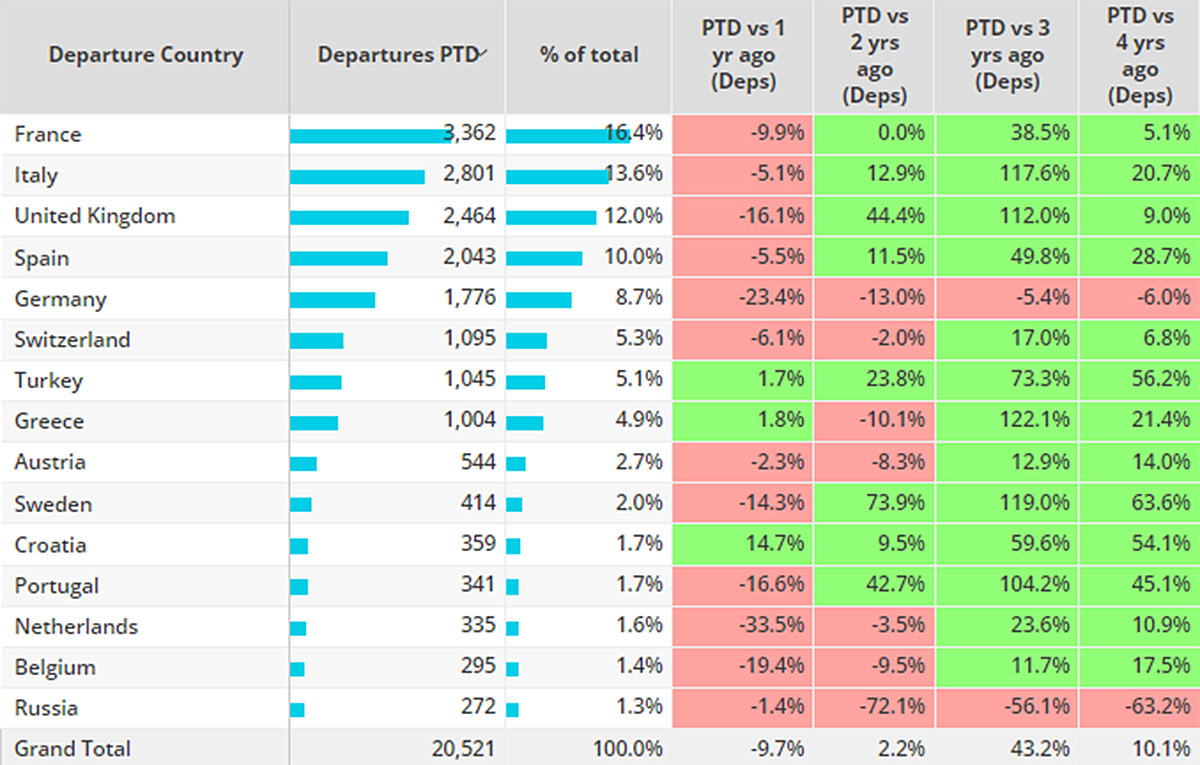
In Week 27, bizjet departures fell 3% compared to the previous week, 10% below the same dates in 2022. The 4-week trend for bizjet activity trails last year by 7%. Between 1st January � 9th July just under 300,000 bizjet sectors have been operated across Europe, 8% fewer than the same period in 2022, 7% ahead of 2019. In the first 9 days of July, European bizjet activity is 10% behind last year, 10% ahead of 2019. All top markets started July behind comparable last year, Germany saw activity dip 6% behind 2019. The Cessna Citation Excel / XLS was the busiest type at the start of this month, departures down 2% compared to last July, 17% ahead of 2019. Contrast third ranked aircraft type, the Bombardier Challenger 300/350 series, departures 5% ahead of last July, 40% ahead of 2019.
Chart 4: Bizjet trends by country, Europe 1st � 9th July 2023 compared to previous years.
Rest of World
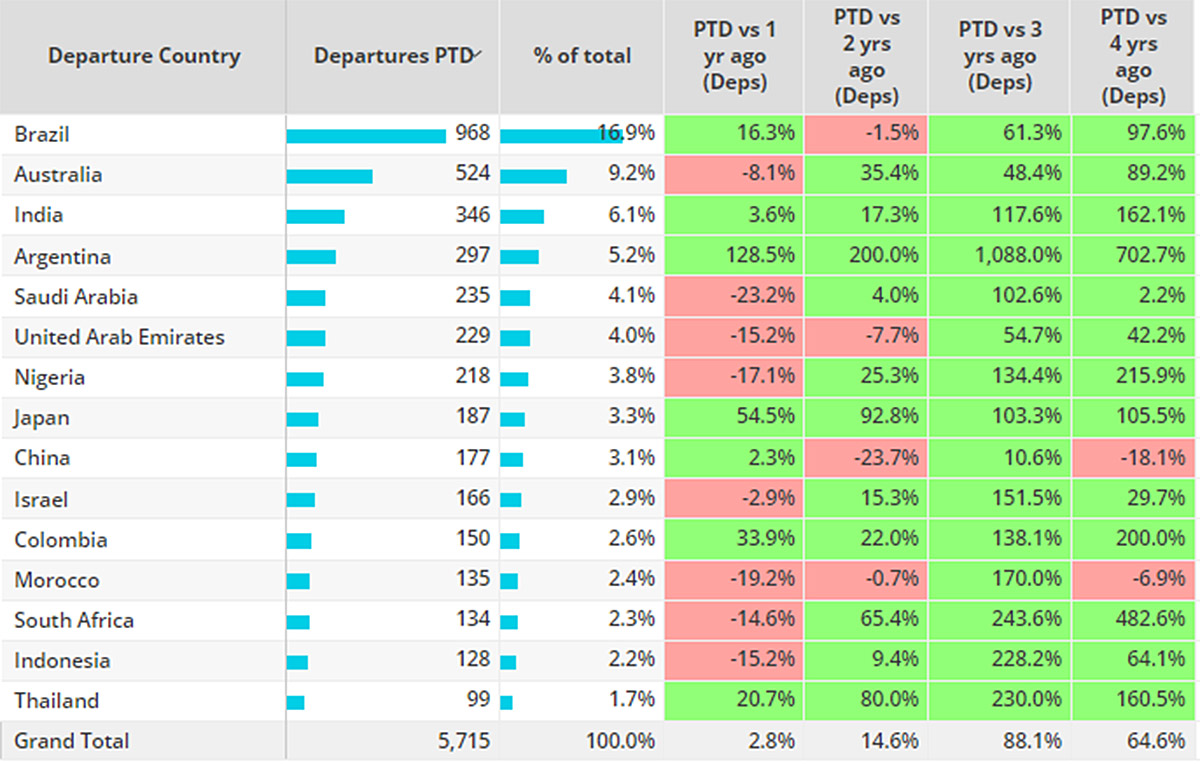
Between 1st January � 9th July, business jet departures outside of Europe and North America are 14% ahead of comparable last year, 74% ahead of 2019. 5,700 bizjet sectors departed airports in the ROW region in the opening 9 days of July, 3% more than last year, 65% more than 2019. 60% of bizjet departures were on domestic flights, domestic flights up 4% compared to last year, double digit growth compared to 2019. International flights are 1% ahead of last year, also seeing double digit growth vs 2019. Demand across the main ROW markets is mixed so far this month, notably triple digit growth vs 2022 in Argentina, double digit declines in Saudi Arabia and United Arab Emirates compared to last year. Tracked bizjet flights from China are down 18% compared to July 2019, 2% ahead of July 2022.
Chart 5: Rest of World Bizjet activity in July 2023 compared to previous years.