WINGX�s weekly Business Aviation Bulletin.
Summary
Business jet demand stuttered in week 35, as reflected in muted Labor Day flight activity. Bizjet demand in Florida was down 20% for Week 35. In Europe, bizjet activity in Germany is falling below 2019 levels. The year-to-date trend in global business aviation is nonetheless only modestly off from 2022 peaks.
Global
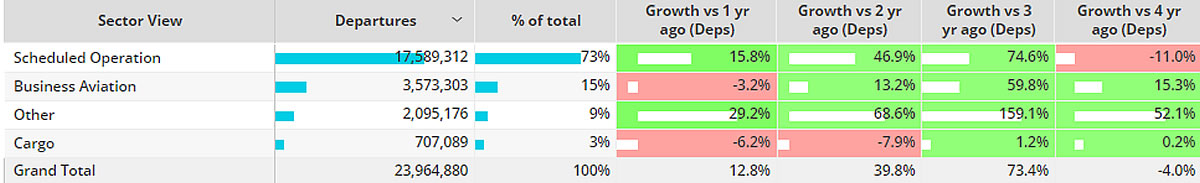
So far this year (1st January – 3rd September), global business jet and turboprop sectors are trending 3% behind the same period last year, 15% ahead of 2019. Focussing on just business jet activity, YTD global sectors are 5% behind last year, 19% ahead of 2019. The top 5 commercial airlines (Southwest, American, Delta, Ryanair & United Airlines) are flying 13% ahead of last year, 7% ahead of 2019.
Chart 1: Global fixed wing flights by sector, 1st January � 3rd September 2023 compared to previous years. (Note business aviation includes turboprops)
Europe
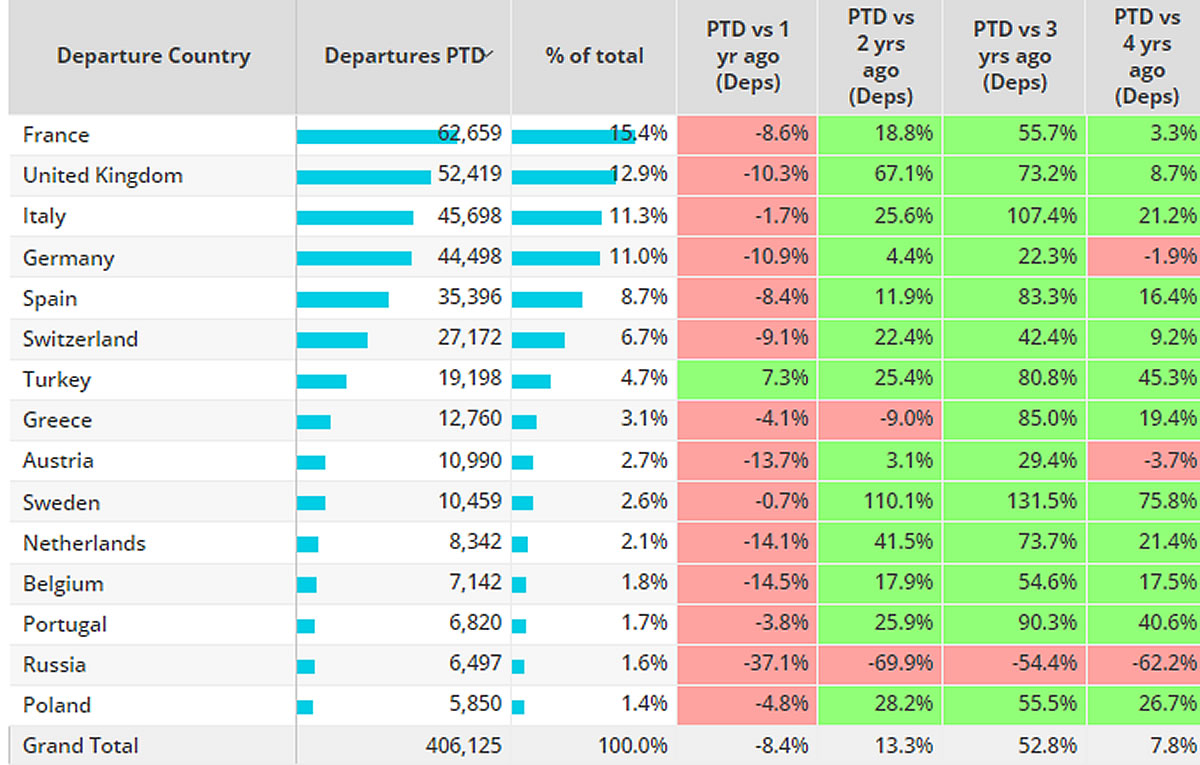
In Week 35, through September 3rd, European business jet activity grew 6% compared to Week 34, 6% below the same dates in 2022. In the last four weeks activity has fallen 8% compared to last year. So far this year, European business jet activity has fallen 8% compared to last year, 8% ahead of 2019. Germany and Austria are seeing activity drop behind 2019 levels, 2% and 4% respectively.
Cessna bizjet fleets are flying by far the most in Europe so far this year, although departures are down 12% compared to last year, 7% ahead of 2019. Bombardier and Embraer fleets are holding up better, departures down 4% and 6% compared to last year, both double digit growth compared to 2019. So far this year Gulfstream aircraft are the most active OEM in Europe, although departures are 2% behind last year, 5% behind 2019.
Chart 2: European Business OEMs, 1st January � 3rd September 2023 vs previous years.
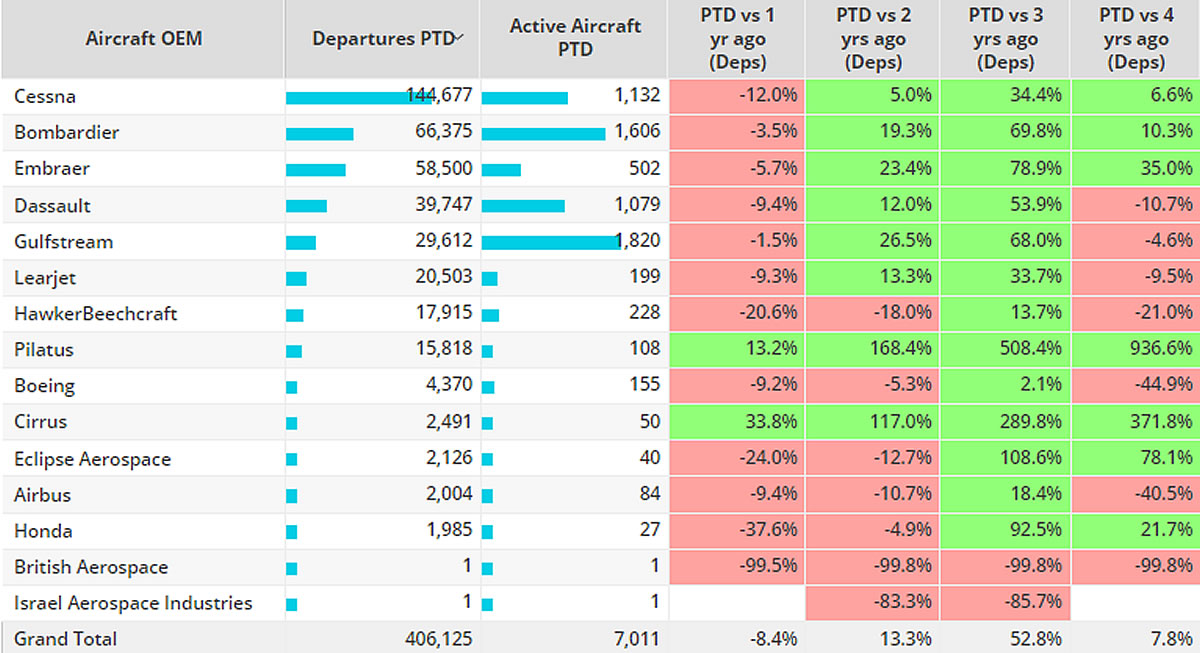
Chart 3: European Business Jet activity 1st January � 3rd September 2023 vs previous years.
North America
In Week 35, business jet activity in North America fell 4% compared to the previous week, 8% below the same dates last year. In the last four weeks activity is 5% below the same dates last year. So far this year there have been 1.8 million bizjet departures across the region, 6% fewer than last year, 18% more than four years ago.
Corporate flight departments are flying 9% fewer flights than last year, slightly below four years ago. Fractional and Aircraft management programmes are well ahead of 2019, although aircraft management programmes are 6% behind last year.
In the United States overall activity is down 6% compared to last year, 16% ahead of 2019. Florida is the busiest state, although activity is down 9% compared to last year. Elsewhere California and Colorado seeing double digit declines compared to last year, second ranked Texas down 6%.
Chart 4: North America business jet operator types, 1st January � 3rd September 2023 vs previous years.
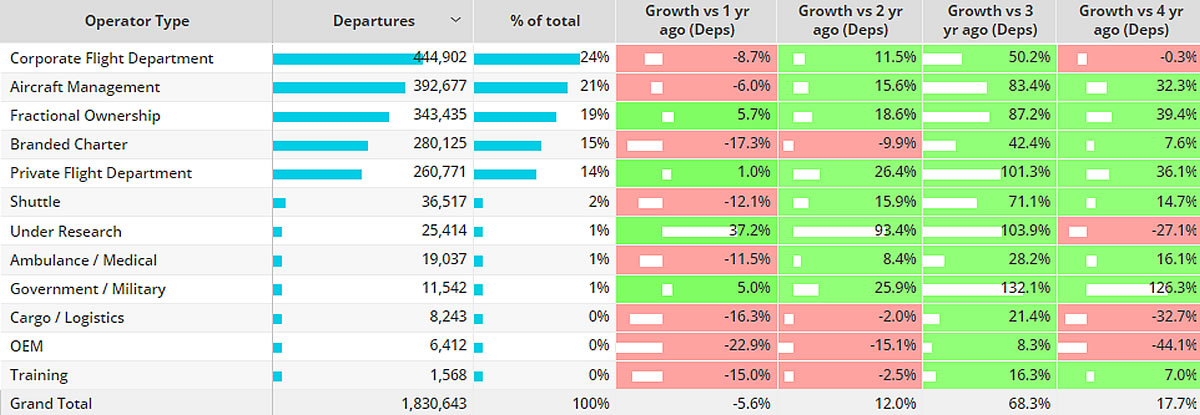
Asia
In Asia, business jet activity this year is 15% ahead of last year, 49% ahead of 2019. India remains the top market, double digit growth compared to last year, triple digit growth compared to 2019. Bizjets in China are trailing 2% behind 4 years ago, although strong growth, 56%, compared to last year. Elsewhere double-digit declines compared to last year in Israel and Philippines, although both well ahead of 4 years ago.
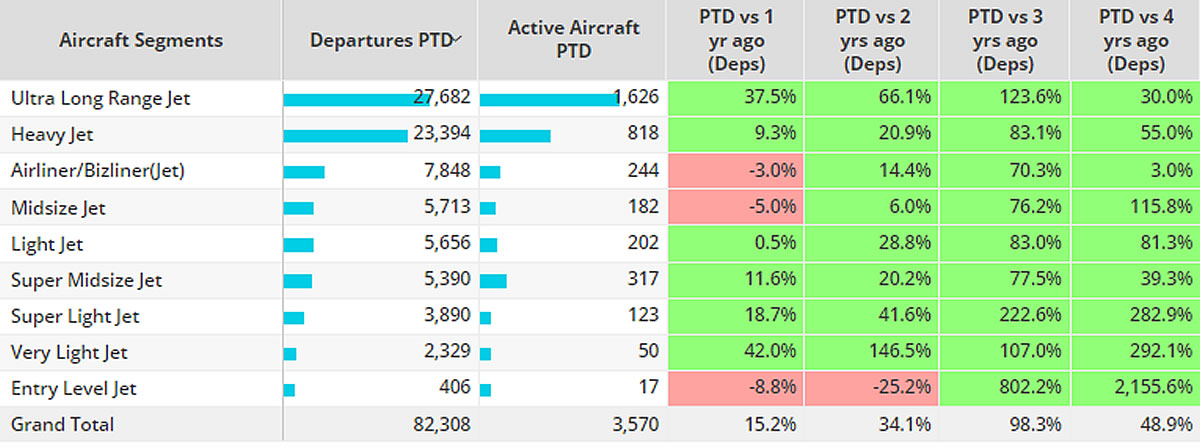
Ultra-long-range jets are the busiest in terms of departures and active aircraft this year, departures 38% ahead of last year. Bizliner activity is ahead of 4 years ago, trailing last year by 3%, Midsize activity 5% below last year, triple digit growth vs 2019.
Chart 5: Business Jet aircraft segments, Asia, 1st January � 3rd September 2023 compared to previous years.
Middle East
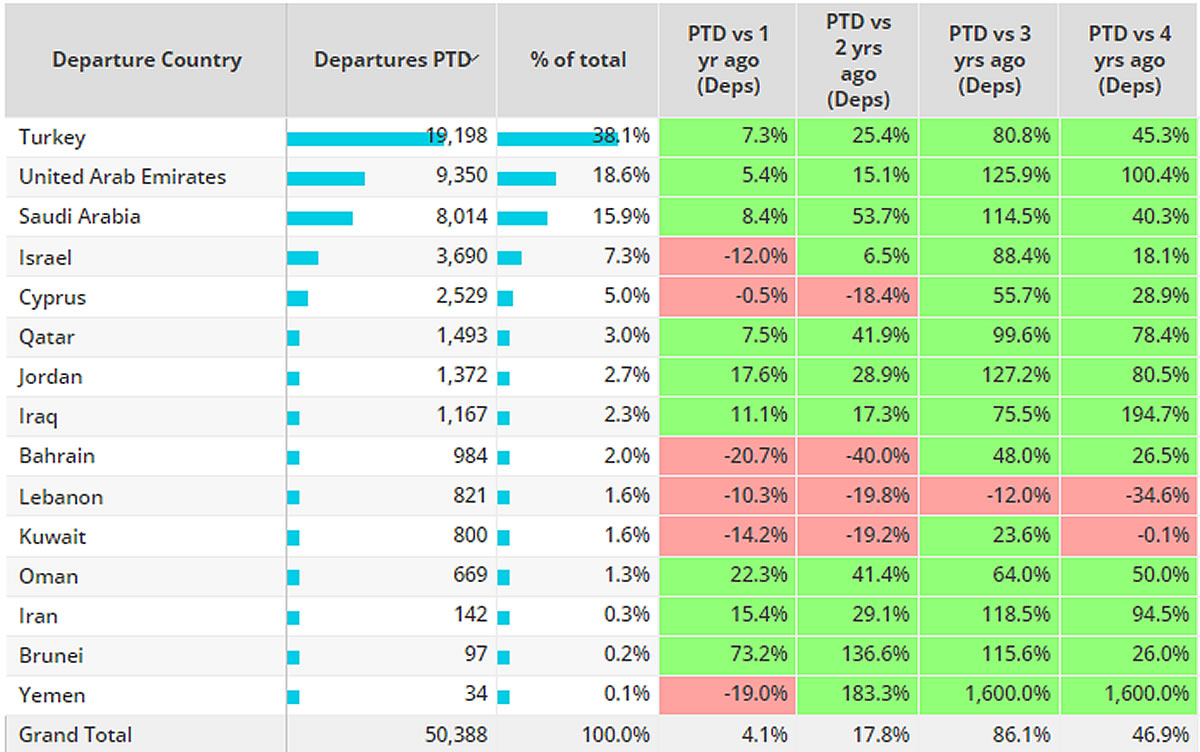
Business jet activity across the Middle East region is 4% ahead of last year, 47% ahead of comparable 2019. A number of key markets are seeing activity dip compared to last year, namely Cyprus, Bahrain, Lebanon and Kuwait. United Arab Emirates is seeing activity double compared to YTD 2019, 5% ahead of last year, Saudi Arabia 8% growth vs last year, 40% above 4 years ago.
Chart 6: Business jet activity by Country, Middle East, 1st January � 3rd September 2023 compared to previous years.