WINGX�s weekly Business Aviation Bulletin.
Summary
Business jet activity in the core North American and European markets has now aligned with 2022 trends as we lap the anniversary of the slowdown post-Covid. The Covid-peaks are now measurable against the late-2021 surge. Comparison with 2019 trends shows a solid 20% gain, with this year trending towards a 4% drop compared to last year.
Global
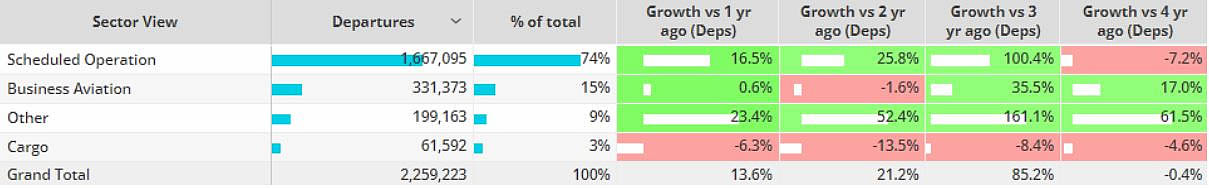
Twenty-two days into October 2023, global business jet and turboprop activity is 1% ahead of comparable October last year, 2% below the highs of October 2021, 17% ahead of 2019. For just bizjets, the year-on-year trend was up 1%, year-to-date trend down 4%, but up 19% on comparable 2019. Scheduled airline sectors are 7% behind 2019 this month, 17% ahead of October 2022. Dedicated cargo operators’ activity so far this month is 6% down year-on-year, 5% behind 2019 levels.
Chart 1: Global fixed wing flights by sector, October 2023 (Note business aviation includes turboprops)
Europe
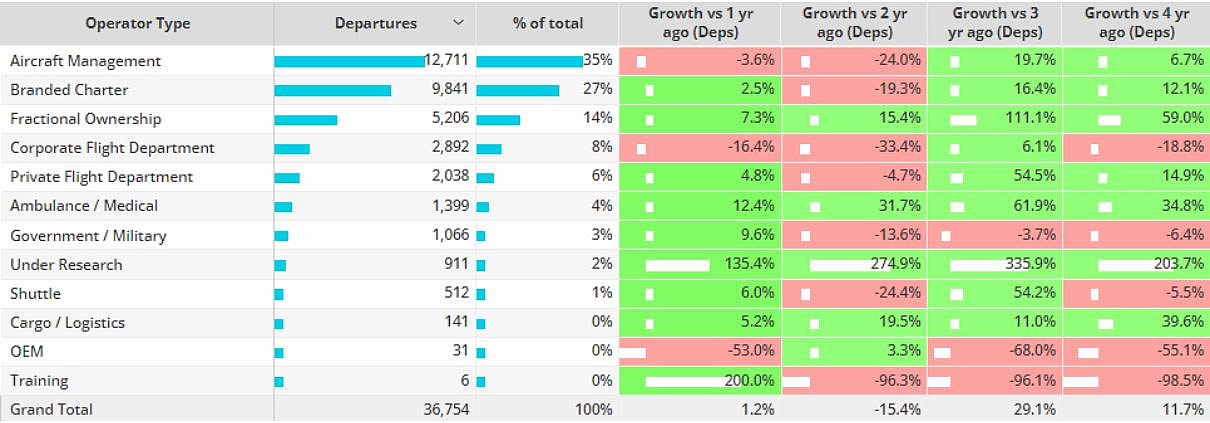
Bizjet activity in Europe is 1% ahead of October last year, 12% ahead of 2019, 15% behind the highs of October 2021. Aircraft management fleets are flying the most activity so far this month, 4% fewer flights than last October, 7% ahead of 2019. Fractional fleets are flying more than any October in the last 4 years. Corporate flight activity is down by 16% compared to last October, 19% declines compared to October 2019. Bizliner activity in the region has rebounded 4% compared to last year, although still 28% behind 2019. Entry level and Midsize jet activity lower than any October in the last 4 years.
Chart 2: Business jet activity operator types, Europe 2023 vs previous years
North America
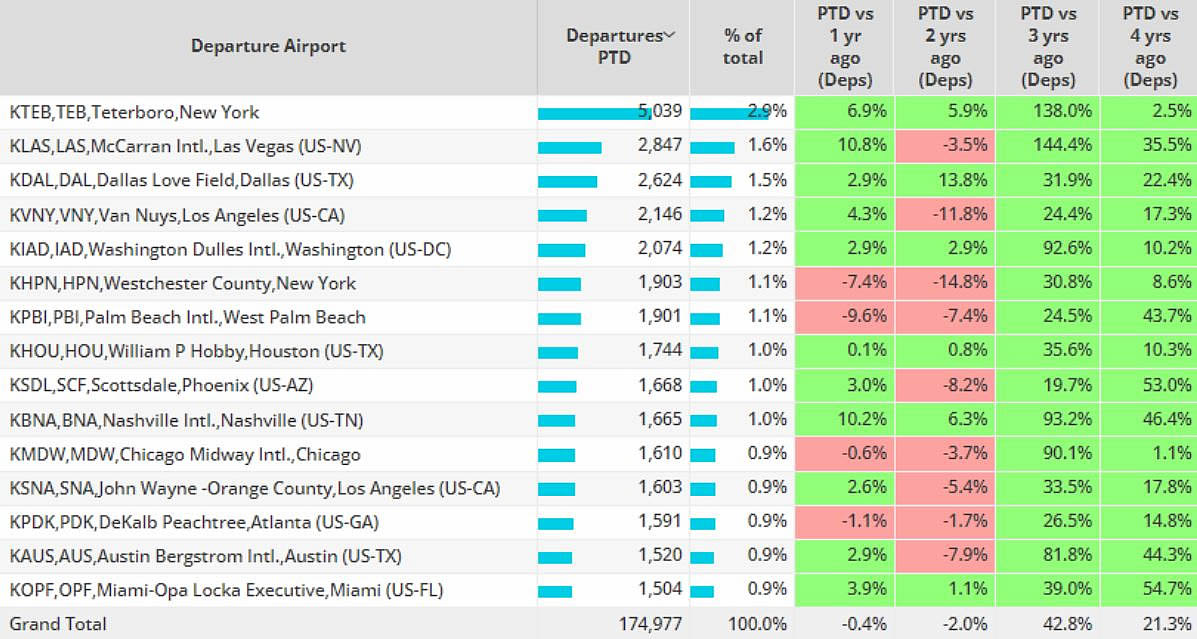
In Week 42, ending October 22nd, business jet activity originating in North America was down 2% compared to the previous week, 3% below the same dates last year. So far this month bizjet activity is slightly behind last year, still 21% ahead of 2019. Teterboro is the busiest departure airport in the region this month, activity is above any October in the last 4 years. Conversely, Westchester County and Palm Beach have 7% and 10% declines respectively, compared to last October.
Chart 3: North America business jet airport departures, October 2023 vs previous years.
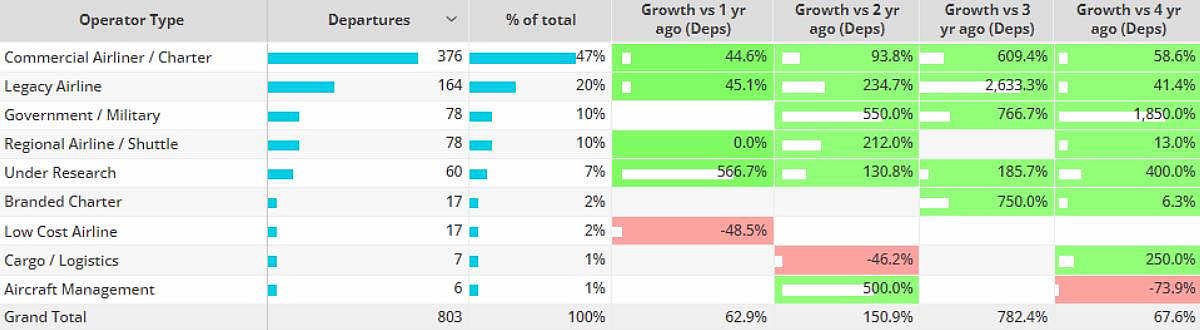
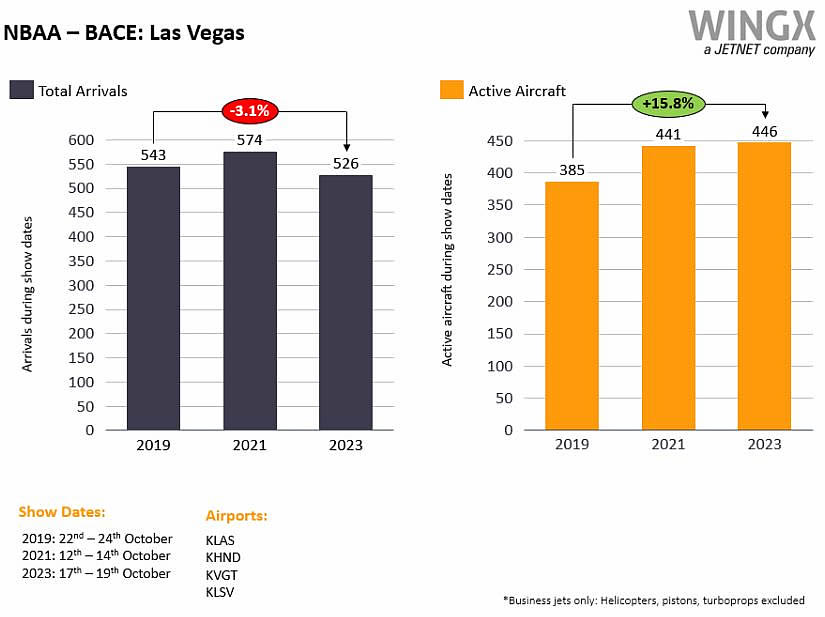
During NBAA-BACE (17th – 19th October), Las Vegas airports (KLAS, KHND, KVGT, KLSV) saw 526 business jet arrivals, 3% fewer than back in 2019, 8% fewer than during the Covid-affected 2021 event. Despite the decrease in arrivals, there were 61 more active aircraft during this year�s show compared to 4 years ago. Elsewhere the US Grand Prix (20th � 22nd Oct) at the Circuit of the Americas attracted 344 bizjet arrivals at nearby airports (KAUS, KEDC, KHYI), down from 475 during last year�s Grand Prix, 15% ahead of the 2019 edition.
Chart 4: NBAA � BACE Las Vegas 2023, 2021, 2019
Asia
Business jet activity is up 12% in terms of sectors flown so far this month compared to last year. India and China are lifting demand. Top market India is 10% ahead of last year, busier than any other October in the last four years, China seeing a 192% spike in activity compared to last year when all flight activity was lockdown-constricted.
Middle East
Bizjet activity in the Middle East continues to trend ahead of comparable October 2022, flight sectors 4% ahead year on year, 51% ahead of 2019. United Arab Emirates, Qatar and Saudi Arabia are busier than in any October in the last 4 years, Qatar seeing 191% growth compared to 2019. Bizjet departures out of Israel are 8% behind last October, although 38% ahead of 2019. Bizjet activity this month peaked on the 7th, falling every day since the 15th. Ad-hoc passenger charter flights out of Israel 45% ahead of October last year, 59% ahead of October 2019.
Chart 5: Ad-hoc flight activity in and from Israel in October 2023