Spring Break in the US has seen the usual surge in bizav in Florida, notably. Compared to same March period in 2019, Florida bizjet departures are up 56%.
Global
For Week 11, through March 17th, global business jet activity was up 2% YOY compared to Week 11 of 2023. 72,223 business jet sectors were flown last week, 1% fewer than the previous week. So far this year, 1st January – 17th March, business jet and turboprop activity is 2% ahead of 2023, 38% ahead of 2019. Scheduled airline sectors are 16% ahead of last year, 8% ahead of 2019. Dedicated cargo sectors have fallen 2% YOY, 24% ahead of 5 years ago.
Chart 1: 1st January � 17th March activity by sector, compared to previous years.�(Business aviation includes business jets & turboprops)
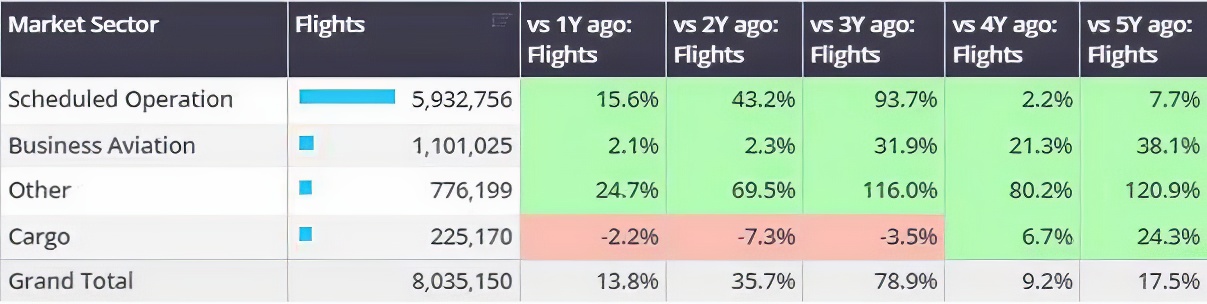
*WINGX added new sources for global flight data in Feb-24, backdated to Jan-23, which has modestly inflated ROW trends vs 2019.
United States
In Week 11, 49,406 business jet sectors were flown in the United States, 2% ahead of Week 11 of 2023, 3% behind Week 10 of this year. The last four-week trend is 2% ahead of the same period last year.
So far this month, bizjet departures from the United States are 1% ahead of March last year, 31% ahead of 2019. Busiest State, Florida has seen 20,353 bizjet departures this month, 4% more than March last year, Texas also seeing small gains vs last year, departures 4% ahead of March 2023. California has seen activity dip less than 1% behind last year.
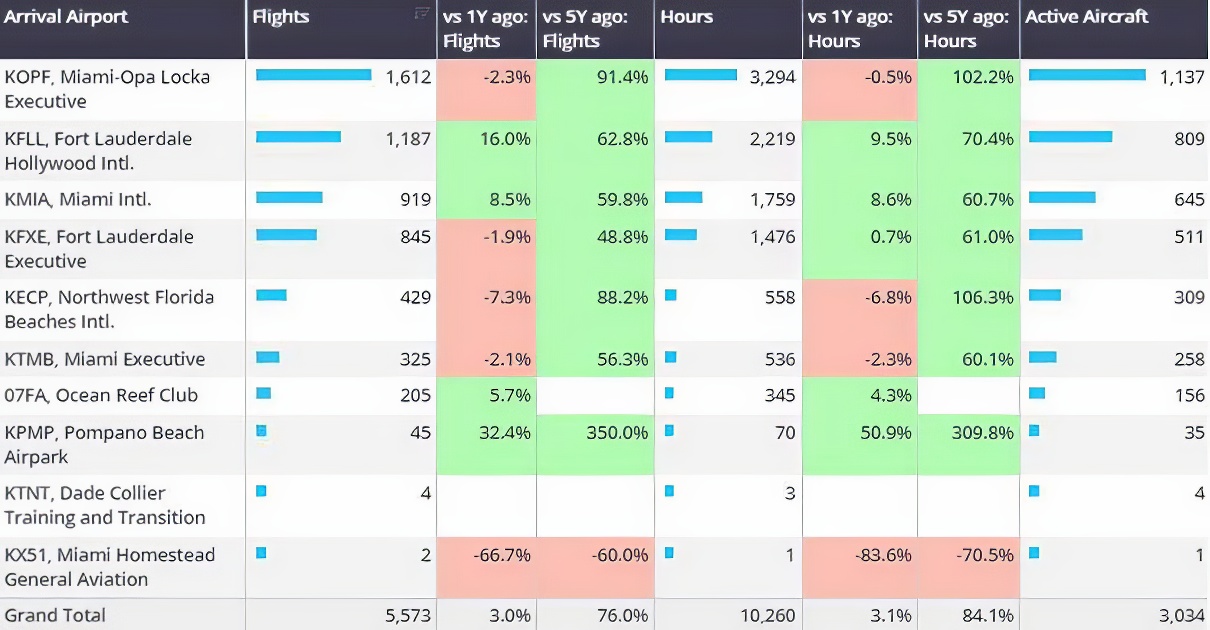
Airports near popular US spring break cities (Fort Lauderdale, Miami, Panama City Beach, San Diego and South Padre Island) are generally seeing more arrivals than previous years. Fort Lauderdale Hollywood international, Miami international, Ocean Reef Club airport and Pompano Beach airpark seeing strong YOY growth.
Chart 2: Bizjet arrivals into Fort Lauderdale, Miami, Panama City Beach, San Diego and South Padre Island airports, 1st � 17th March 2024 vs 2019.
Europe
In Week 11, European business jet activity was 4% below Week 11 last year, 3% ahead of Week 10 of this year. The last four-week trend is trending 1% below the same four weeks last year.
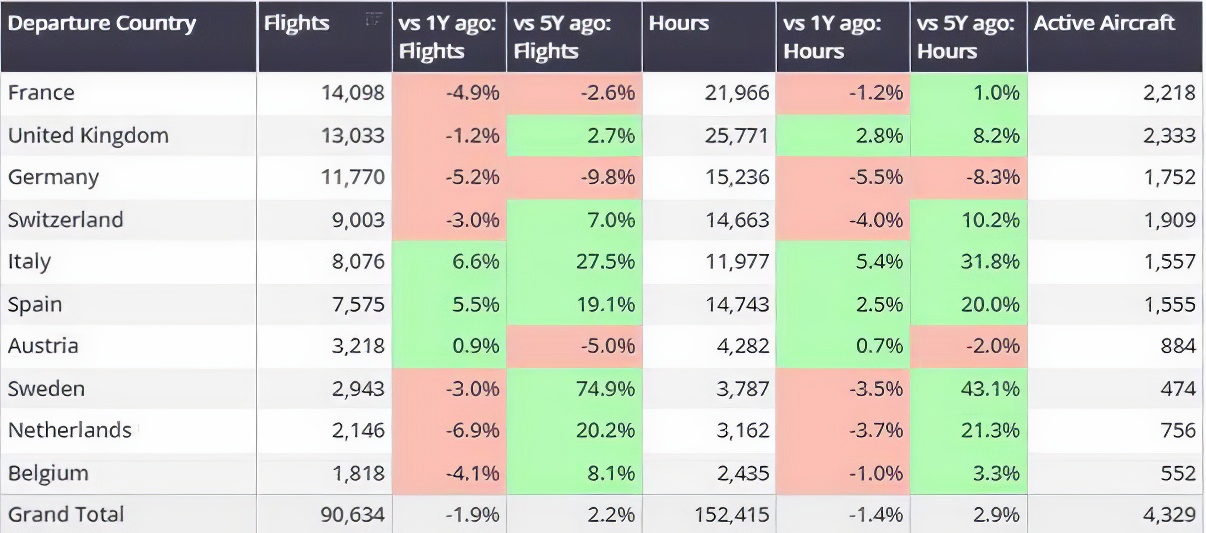
In Week 11, activity in France fell 11% compared to Week 11 in 2023. Contrast Italy, departures are 16% ahead of Week 11 in 2023. Aircraft Management fleets in Week 11 in France are flying 16% fewer flights compared to the same dates in 2023, branded charter fleets flying 15% fewer flights than last year. Ultra long-range jets buck the weekly trend, departures are 14% ahead of last year, most ULR flights are domestic, United Kingdom and the United States are the top international connections for ULR fleets in W11.
Year to date, Le Bourget is the busiest bizjet departure airport, although activity has fallen 7% YOY. Bizjet activity out of Geneva has fallen 4% behind pre-pandemic, out of Geneva, heavy, very light and midsize jets seeing large declines in YOY activity, -20%, -24%, -29% respectively. France is the busiest international destination from Geneva, although activity is 12% behind last year, flights to Italy up 9% YOY.
Chart 3: Business Jet departures in Europe, January 1st � March 17th 2024 vs previous years.
Rest of World
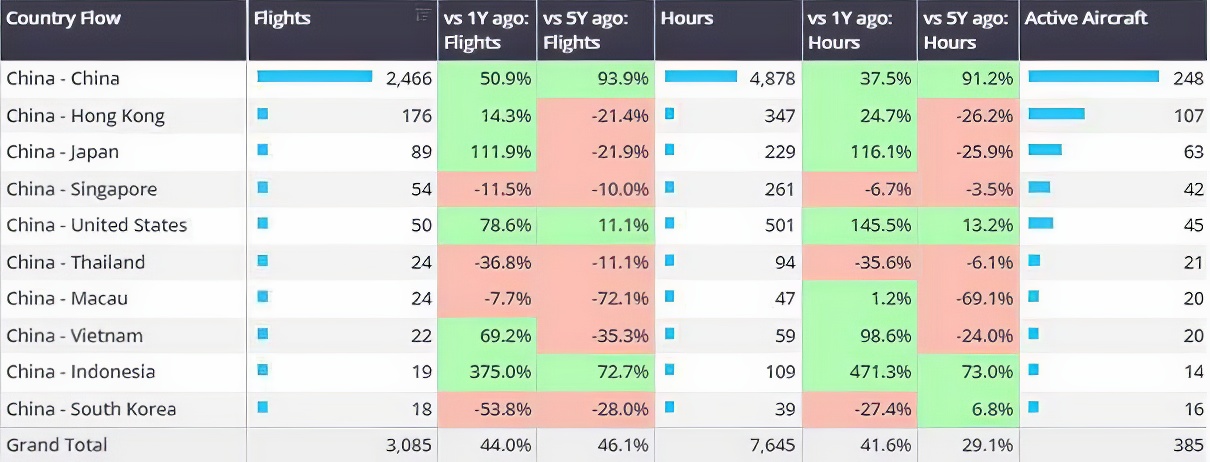
In Week 11, bizjet activity in the Middle East fell 29% compared to the previous week, 32% below Week 11 in 2023. Year to date, business jet sectors across the region fell 5% compared to last year, 62% ahead of 2019. In the United Arab Emirates activity has fallen 7% compared to last year, Saudi Arabia on par with last year. Other countries in the region seeing YOY growth, Qatar and Bahrain 4% and 7% ahead of comparable 2023. Elsewhere activity in China is 44% ahead of last year, domestic sectors 51% ahead of 2023. Hong Kong, Japan and Singapore are the top connections outside of mainland China this year.
Chart 4: Business jet departure country flows from China, 1st January � 17th March 2024 vs previous years.