Overall flight volumes are so far very similar to last year, but with considerable variance by region and operator type, with demand in Europe clearly ebbing, the US flat overall but at record highs in New Jersey, fractional operations powering ahead.
Global
For Week 13, through March 31st, global business jet activity was down 4% YOY compared to Week 13 of 2023. 66,983 business jet sectors were flown last week, 9% below the previous week. Year to date, 1st January – 31st March, global business jet activity is slightly ahead of last year, 2% down compared to 2022, 32% ahead of comparable 2019. Scheduled airline activity is 17% ahead of last year, 9% ahead of comparable 2019. Dedicated cargo sectors have fallen 2% behind last year, 24% ahead of 2019.
Chart 1: 1st January � 31st March activity by sector, compared to previous years.�(Business aviation = business jets only)
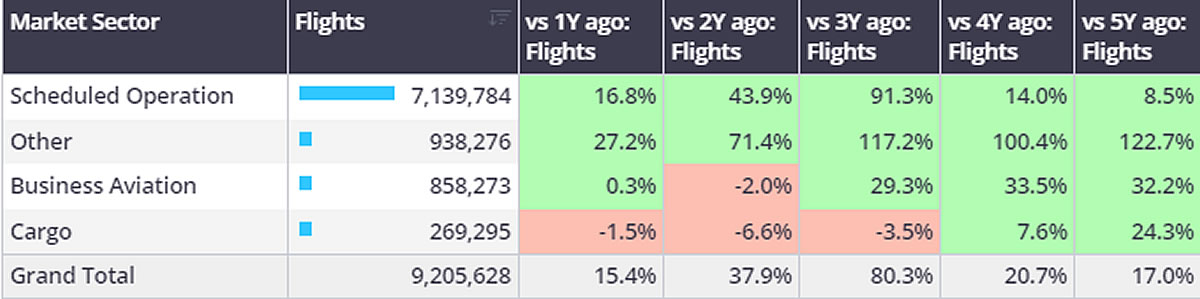
*WINGX added new sources for global flight data in Feb-24, backdated to Jan-23, which has modestly inflated ROW trends vs 2019.
United States
In Week 13, 46,127 business jet sectors were flown in the United States, 9% below the previous week, 4% below of Week 13 in 2023. So far this year, US bizjet activity is on par with last year, 4% below the highs of 2022, 28% ahead of 2019. Busiest States Florida and Texas are seeing year-on-year growth, California on par with last year.
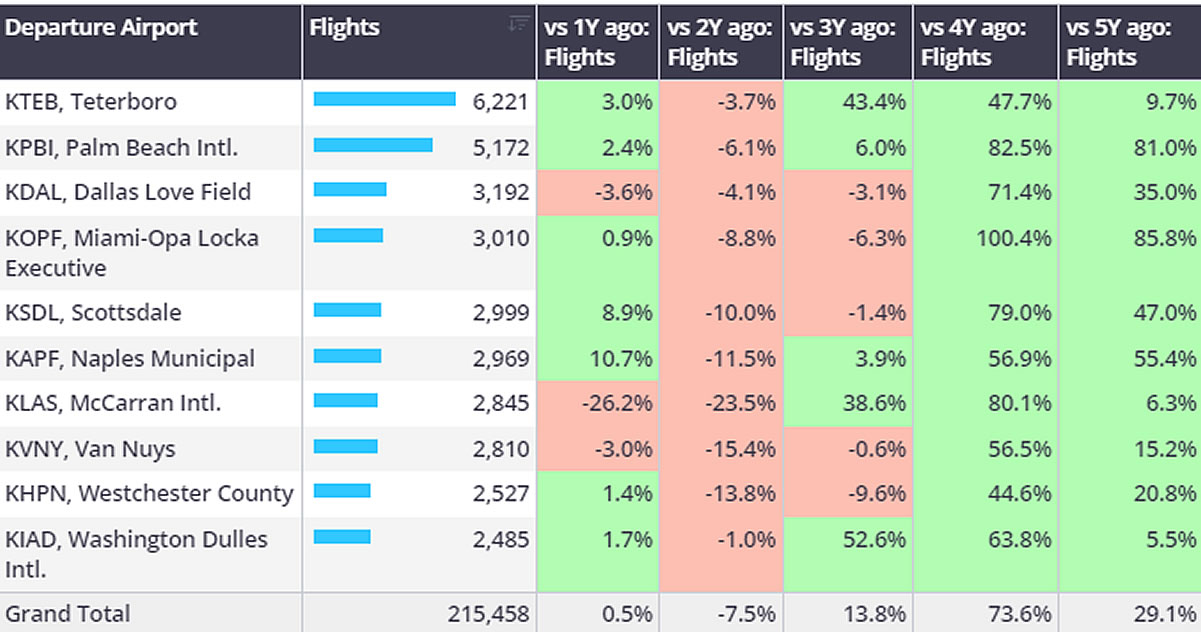
In March, business jet activity in the United States was just 1% ahead of last year, 8% fewer flights than 2022, although 29% more than 2019. Busiest airport Teterboro saw just under 1,100 more flights than second ranked Palm Beach, both airports ahead of last year, down on comparable 2022. Fractional operators ran hot in March, flying more flights than any other March in the last 5 years. Contrast Corporate Flight Departments, flying 14% fewer flights than last March, 13% fewer than March 2019. Light jets are the busiest aircraft segments for Corporate Flight Department fleets, sectors down 11% compared to March last year. Ultra-Long-range jets are the only aircraft segment operated by corporate flight departments to see growth compared to March 2019.
Chart 2: US Departure States, bizjets, 1st January � 31st March 2024 vs previous years.
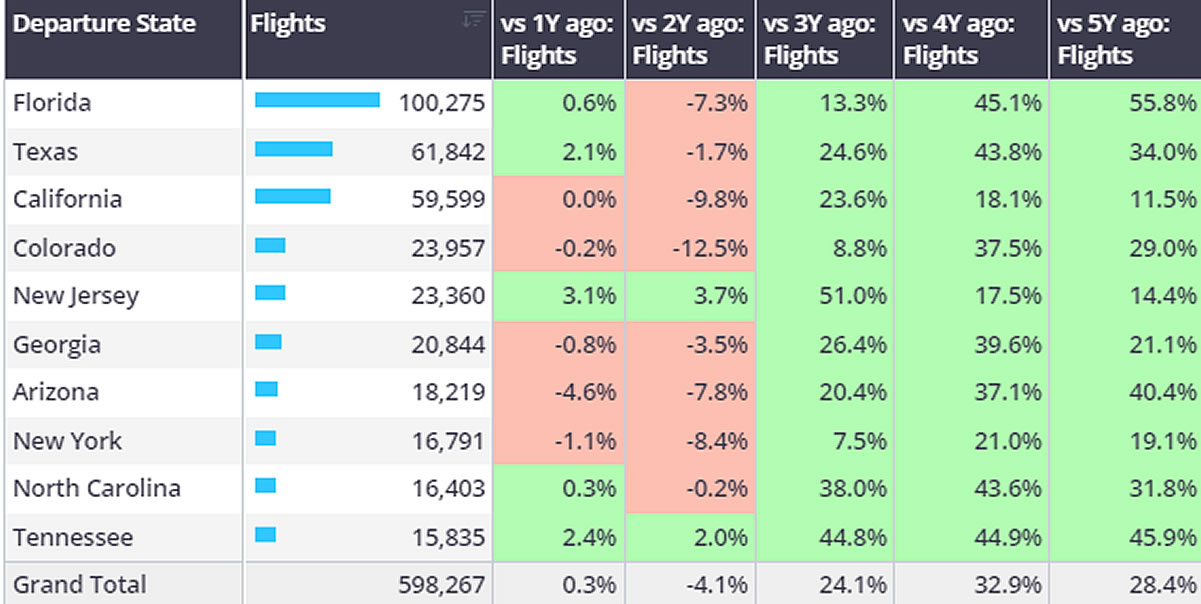
Chart 3: US bizjet departure airports, March 2024 vs previous years.
Europe
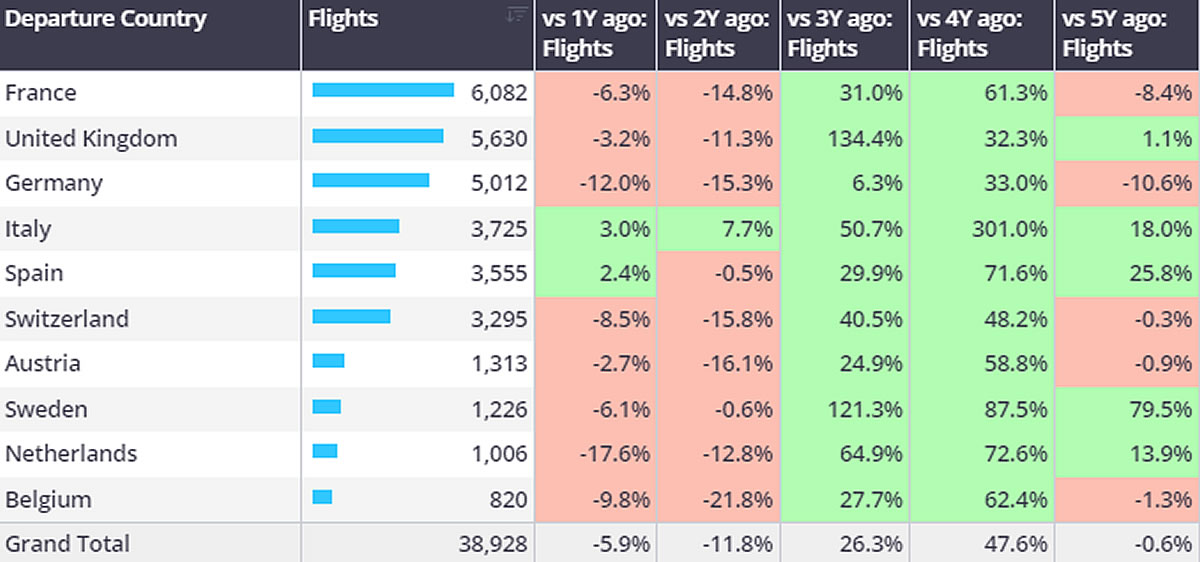
In Week 13, European business jet activity was 13% below Week 13 2023, 9% below the previous week. Year to date, European bizjet activity has fallen 3% compared to last year, 11% below 2022, however 1% ahead of comparable 2019. Italy is the only country in the top 5 to see growth compared to last year, France, Germany and Austria are behind comparable 2019 by 4%, 12% and 3% respectively.
In Europe, bizjet activity in March ended 6% below last year, 12% below March 2022, 1% below March 2019. Busiest market France saw flights fall 6% below last year, 8% below 2019. The United Kingdom was the only country in the top 3 to see growth vs March 5 years ago. Italy stood out, seeing the busiest March for bizjet activity in the last 5 years. Just over 1,200 domestic bizjet flights were flown in March in Italy, 5% more than last year, 9% more than 2019.
Bizjet activity this Easter weekend (Friday29th � Sunday 31st March) was subdued compared to Easter last year and 2022. Compared to the same Friday � Sunday period, bizjet sectors fell 1% this year compared to 2023, 11% below 2022, however 4% ahead of comparable 2019. The top 5 bizjet markets this Easter weekend were all domestic markets, France � United Kingdom was the busiest international connection, followed closely by Italy � France.
Chart 4: Top European bizjet countries, March 2024 vs previous years.�
Rest of World
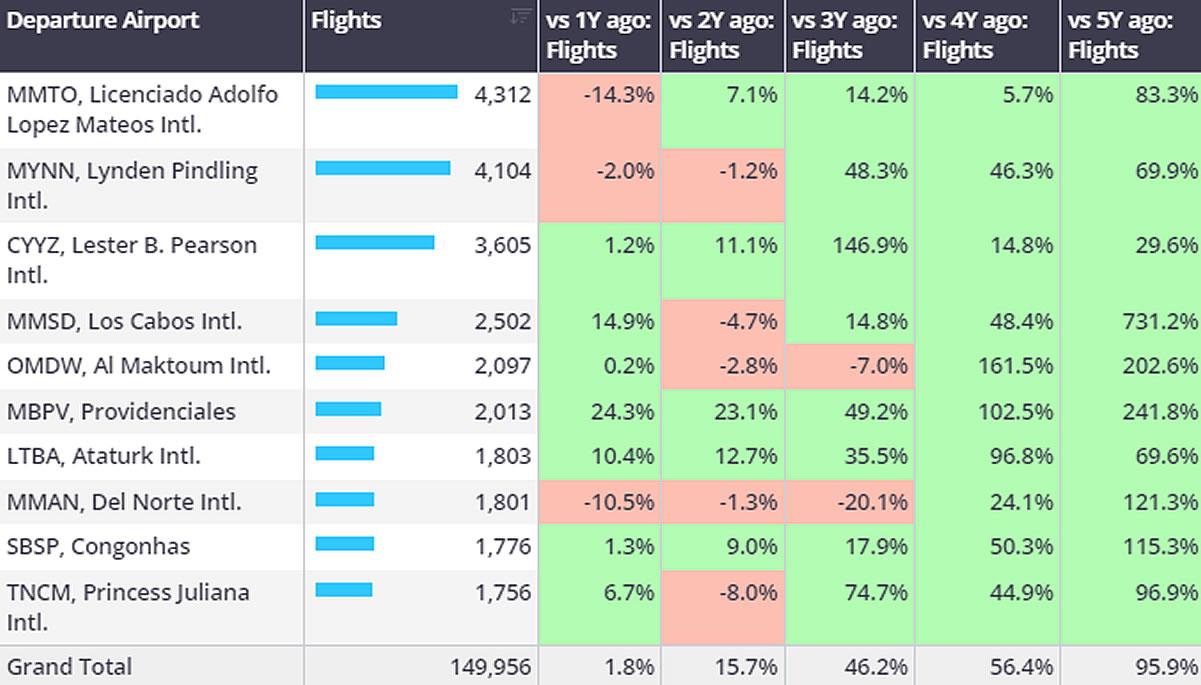
In Week 13, bizjet activity in the Middle East fell 3% compared to the previous week, falling 2% behind Week 13 in 2023. Year to date, bizjet sectors in the United Arab Emirates have fallen 7% compared to last year, although triple digit growth compared to 2019. YTD China has seen bizjet sectors jump 60% ahead of last year, 56% ahead of 5 years ago. Elsewhere India and Australia busiest than each of the last 5 years.
Chart 5: Busiest bizjet airports outside of US and Europe, 1st January � 31st March 2024 vs previous years.