
WINGX�s weekly Business Aviation Bulletin.
Summary
March 2022 was the record peak in business aviation activity, reflecting the pent-up demand as the pandemic faded and lockdowns were released, so it’s not a great surprise to see lower YOY activity. However, with emerging concerns of another global financial crisis, we may well see further softening in business jet usage in the next few months.
Global
Worldwide business jet sectors in Week 10 of 2023, March 6th through March 12th, amounted to 70,829 sectors, a 4% increase compared to week 9 2023, a 7% decrease compared to the same dates in 2022. The global bizjet trend for the last 4 weeks is 7% behind the same dates last year. Global Part135 and Part91K bizjet activity in week 10 was 15% below the same dates last year. Year to date (Jan 1st – March 13th), business jet activity is 3% behind last year, still 16% ahead of 2019. Focussing on business jet activity so far this month (March 1st � 13th), flight sectors are 9% down compared to last year, still 17% ahead of March 2019.
Global fixed wing flights, March 1st � 13th 2023 compared to previous years. (Note business aviation includes turboprops)

North America
In Week 10, 56,316 bizjet sectors departed North American airports, 6% more than Week 9, 8% fewer than the same dates last year. In the last four weeks activity is 8% below the same dates last year. Part135 and Part 91K activity during week 10 was 5% up compared to week 9, 15% below the same dates in 2022.
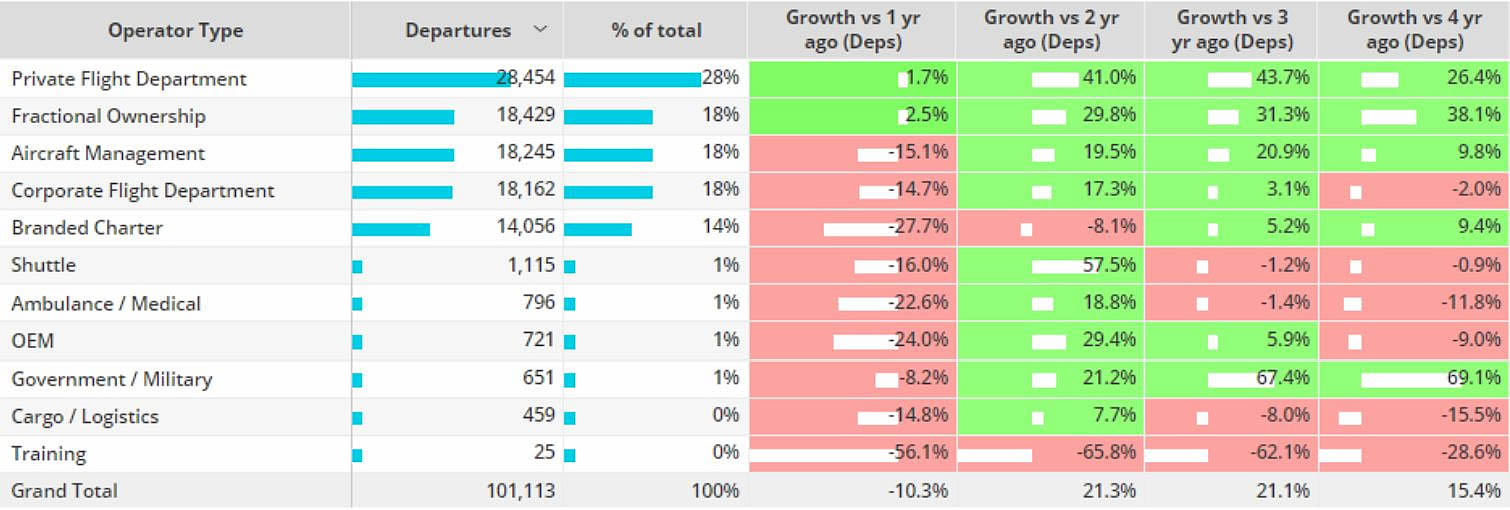
Business jet departures from North America are down 10% so far this March compared to comparable 2022, 15% above comparable 2019. Private flight departments and Fractional operators are flying more this month compared to last year, 2% and 3% retrospectively, well ahead of 2019, 26% and 38% retrospectively. Despite flying 9% more sectors than 2019, Branded Charter flights are 28% behind comparable last year. Corporate flight department flights have fallen 2% behind March 2019, 15% behind March last year.
Focussing on United States bizjet activity in March, sectors are 11% behind comparable last year, still 19% ahead of 2019. 93% of flights have been domestic this month, 7% international. Domestic flights are down 12% compared to last year, 19% ahead of 2019. International flights are on par with last year, 21% ahead of 2019. Mexico is the top international destination this month, flights are down 8% compared to last March, although 28% ahead of 2019. Flights to Canada are still behind pre-pandemic 2019 by 14%, rebounding 3% ahead of last year.
North America bizjet operator types 1st � 13th March 2023 vs previous years.
Trans-Atlantic bizjet sectors (North America � Europe), so far this month are up 3% compared to comparable 2022, 31% ahead of 2019. United States � United Kingdom is the busiest country flow, flights down 8% compared to last year, up 49% compared to 2019. Other top connections are between the United States and France, Ireland and Spain. Flights between the United States and Switzerland and Italy are below last year, -3% and -9% retrospectively.
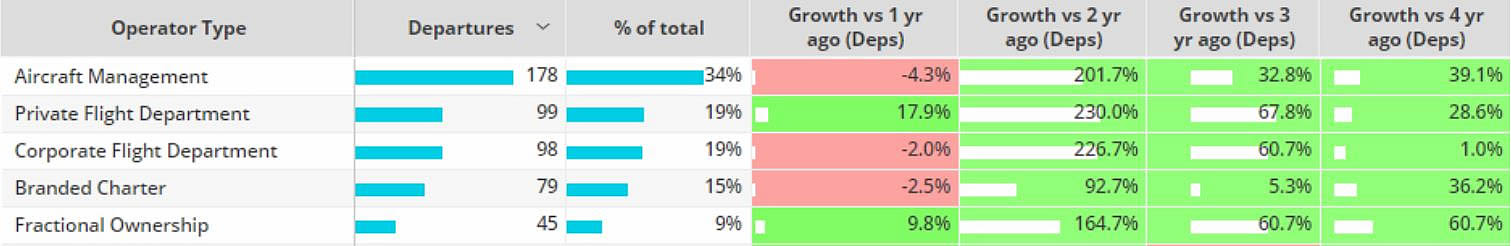
Top 5 Trans-Atlantic Business Jet Operator Types March 1st � 13th 2023 vs previous years.
Europe
In Europe, 9,292 bizjet sectors were flown in week 10, 2% more than in week 9, 7% fewer than the same dates in 2022. In the last four weeks activity is 11% below the same dates in 2022. Business jet sectors in March are down 9% compared to last year, although 4% above 2019. Excluding Russia and the trend this month is 8% behind last year, 8% ahead of 2019. 71% of bizjet activity this month is on international flights, these flights are 9% below last year, 5% above 2019. Domestic bizjet sectors are 7% down on last year, 3% ahead of 2019.
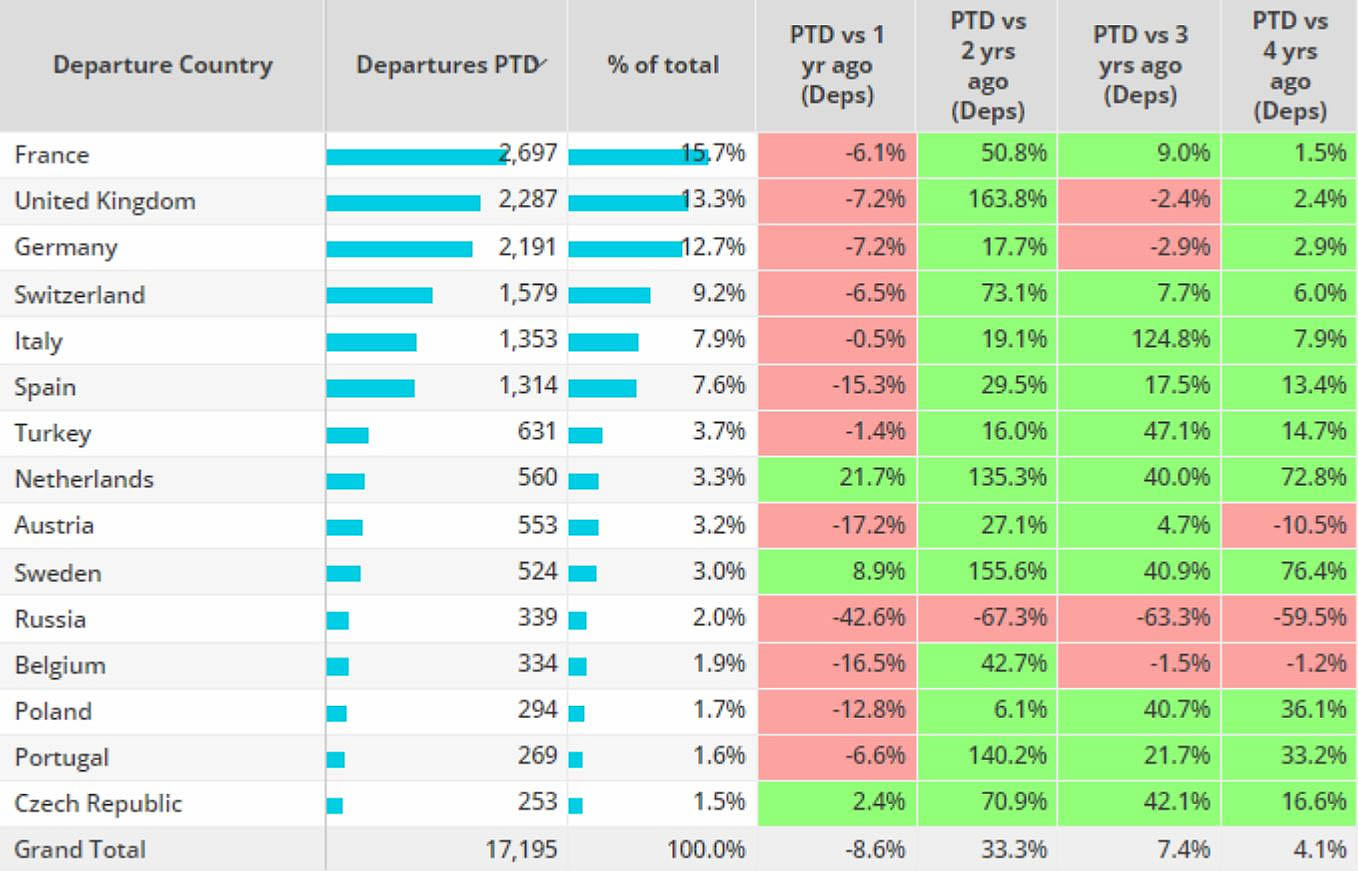
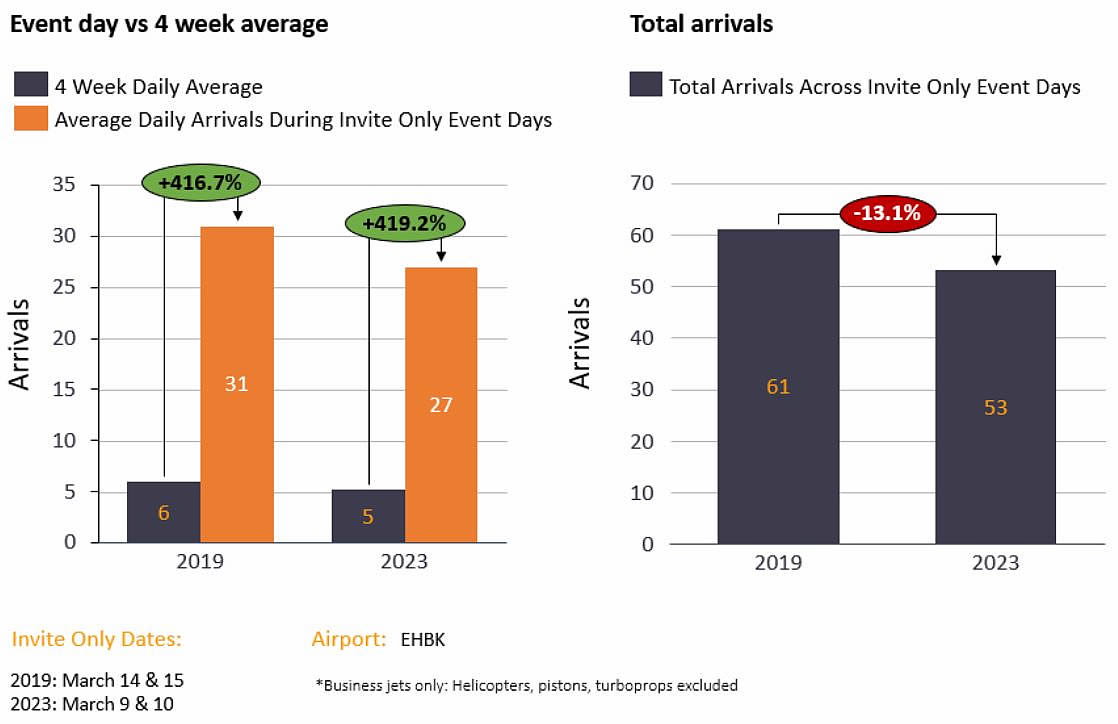
Branded Charter and Aircraft management fleets are seeing double digit declines in flight activity compared to last March, 15% and 11% down on 2022 retrospectively, Aircraft Management fleets seeing a 12% fall compared to February 2019. France is the busiest market so far this month, followed by the United Kingdom and Germany. In Maastricht the hosting of the TEFAF had a significant impact on bizjet arrivals into Maastricht Aachen Airport, during the first 2 days of the event, which were invite only, bizjet arrivals saw triple digit growth compared to the average daily arrivals in the last 4 weeks.
Top European Business Jet Markets, March 1st � 13th 2023 compared to previous years.
Maastricht business jet arrivals during TEFAF 2023 vs 2019
Rest of World
In Week 10 of 2023, March 6th through March 12th, activity in Africa was up 1% compared with the same dates last year, Asia up 18%, Middle East up 3% and South America up 16%. So far this month ROW bizjet activity is 17% ahead of last year, 78% ahead of 2019. Brazil, Australia and India are the top three markets, all seeing demand above last year. China has seen activity drop 2% below comparable 2019, 36% ahead of this year.