WINGX�s weekly Business Aviation Bulletin.
Summary
Business jet traffic continues to bump along between 5% and 10% below the record-breaking levels in 2022, between 15% and 20% above 2019 levels. Ultra Long Range and Very Light jets have strongest trends compared to 2019, reflecting solid demand for new heavy jets, whilst the smaller cabin demand is exposed to economic turbulence, but also still benefitting from gaps in the regional airline networks.
Global
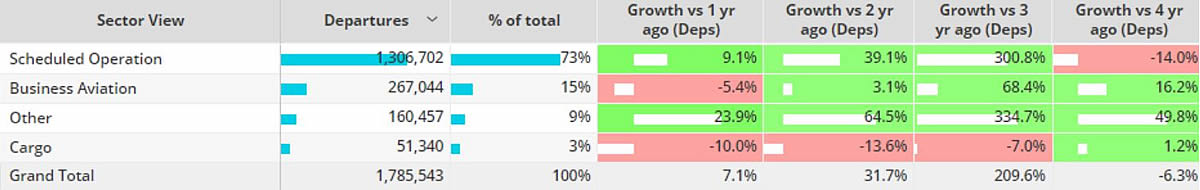
In the first 18 days of June 2023, worldwide business jet and turboprop sectors dipped 5% on the same period in June 2022, 16% ahead of comparable 2019. Business jet flights in week 24 fell 6% short of the same week last year and is trending down by 6% over the last 4 weeks. Scheduled airline activity is up 9% on 2022 in terms of sectors operated globally, but still down 14% on 2019. The top 5 busiest airlines (Southwest Airlines, American Airlines, Delta Airlines, Ryanair, United Airlines) are 11% busier than last year, 8% ahead of 2019. Cargo operations are down by 10%, still up 1% compared to 2019.
Chart 1: Global fixed wing flights, 1st – 18th June 2023 compared to previous years. (Note business aviation includes turboprops)
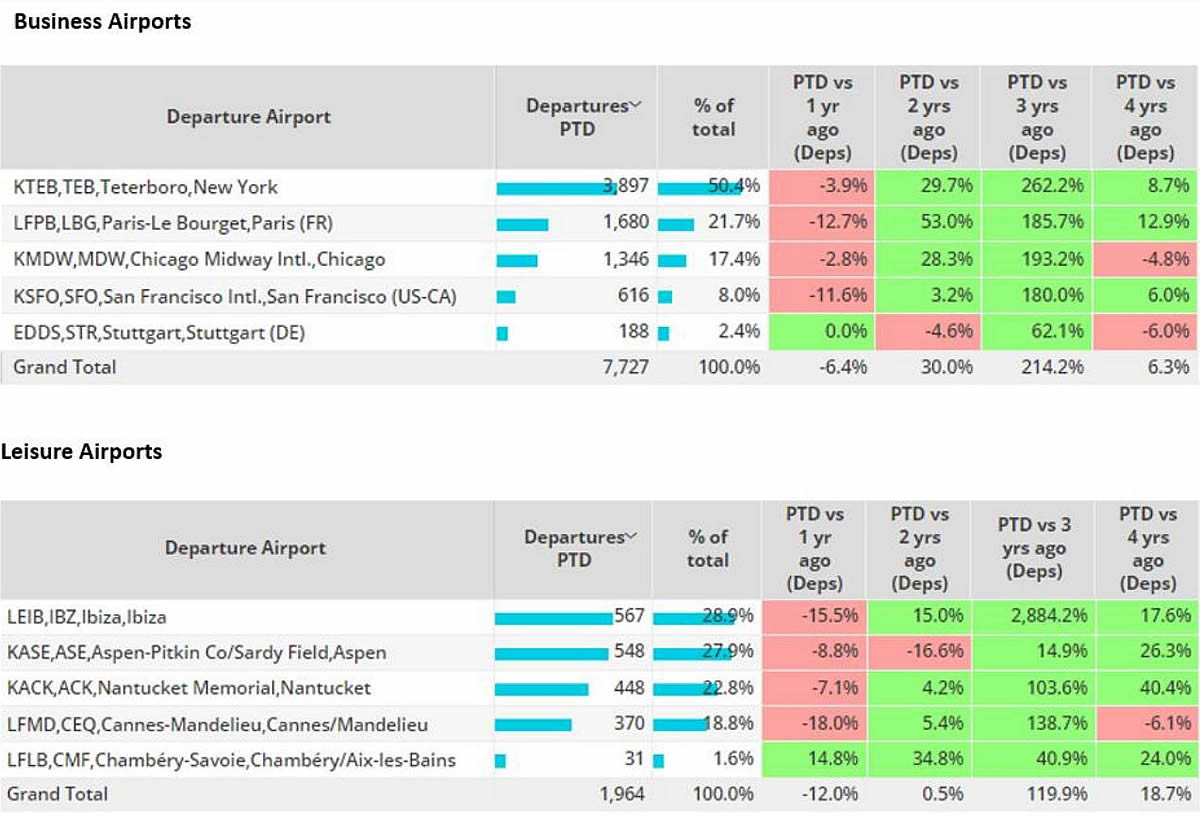
Business jet travel still appears to be biased towards leisure travel, with weekend trends stronger than weekday travel consistently over the last 24 months. An index of typical-leisure compared to typical-business destinations underlines more robust demand for inferred leisure trips. Corporate flight departments have fully not recovered flight volumes from 2019, whereas branded charter operations, measured globally, are still 10% up on where they were 4 years ago.
Chart 2: Business vs Leisure Airports, Business Jets 1st � 18th June 2023 vs previous years.
North America
In Week 24 (ending June 18), business jet activity in North America grew 3% compared to the previous week, 7% below the same dates in 2022. In the last four weeks, regional bizjet activity is also 7% behind the same dates in 2022. Bizjet movements in the US represented 92% of the regional total activity, with 47,803 sectors in week 24 up 2% on week 23, down 7% year-on-year, on par with the last 4-week downwards trend of 7%. The last 52-week peak activity was 15% higher, at 55,000 flights, in week 41 last year.
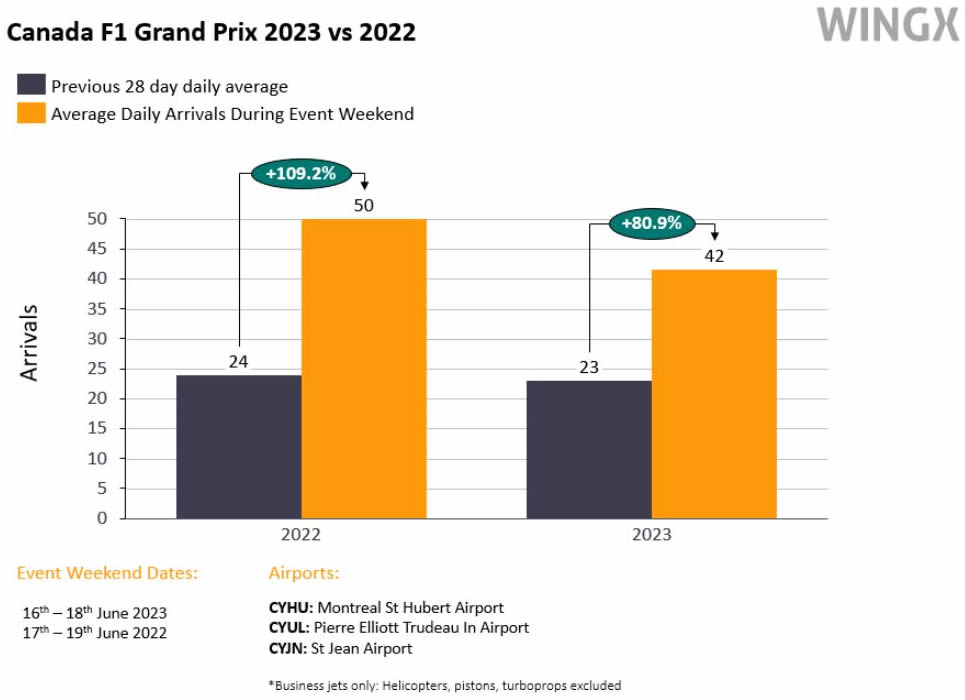
Business jet traffic in Canada is trending 1% above last June, 13% ahead of pre-pandemic June 2019. Montreal airports (CYHU, CYUL, CYJN), experienced an influx of business jet traffic last weekend (16th � 18th June) due to the F1 Grand Prix. During the Grand Prix days, average daily arrivals rose 81% compared to the daily average for the previous 28 days. This was a significant upsurge but relatively smaller than in 2022. Likewise, the 125 bizjet arrivals into Montreal airports during this Grand Prix was down 17% compared to the 2022 edition of the race.
Chart 3: Business jet arrivals into Montreal airports during Canada F1 Grand Prix.
Europe
In Week 24 European business jet activity grew 7% compared to the previous week, 7% below the same dates in 2022. In the last four weeks, bizjet activity is 10% below the same period in 2022. Across the European region, business jet activity has fallen 9% behind June 2022, still 8% ahead of 2019. Bizjet flights in France, Europe´s top market, are 8% down on June last year, still 4% ahead of June 2019. The United Kingdom and Germany have seen double digit declines compared to last year, although both are ahead of June 2019. The most popular business jet in Europe is the Phenom 300, 2,474 flights, up 53% this June vs June 2019.
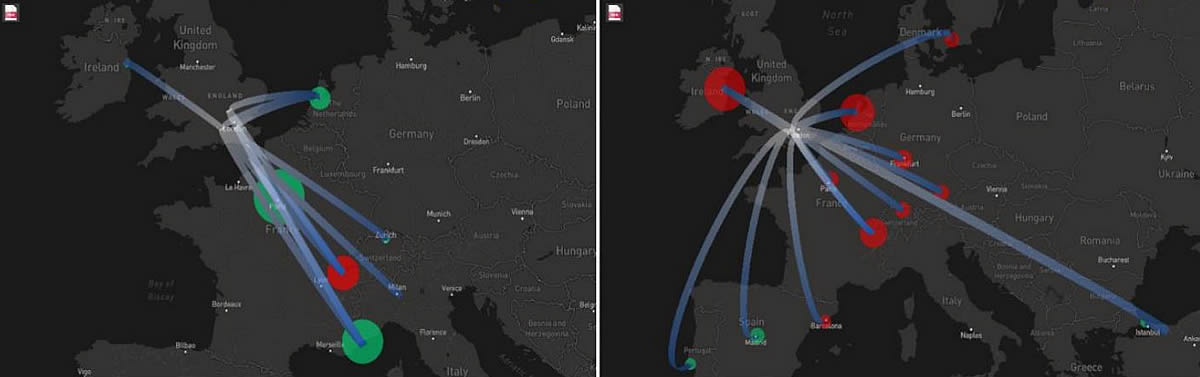
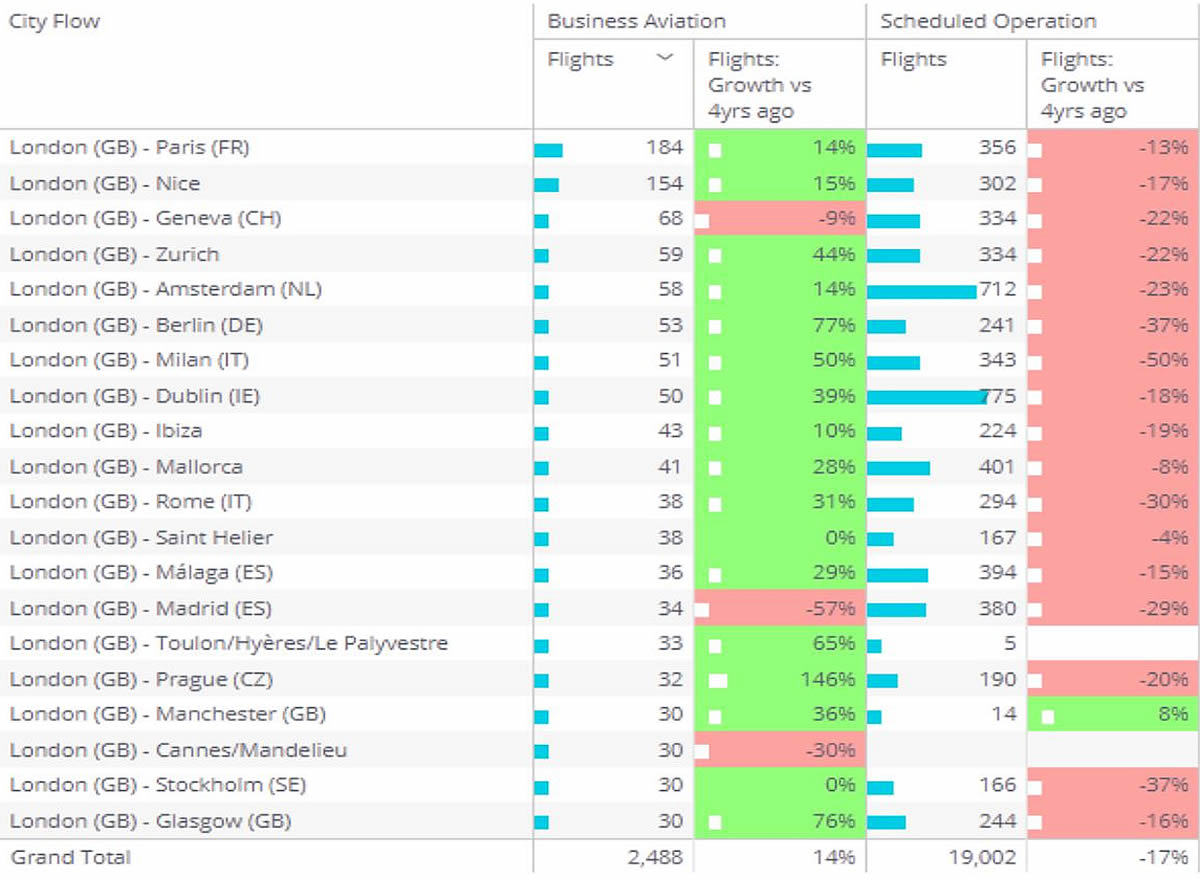
Business jet demand in Europe continues to correlate inversely to airline connectivity from major metro hubs, still significantly depleted compared to pre-pandemic. From London, aggregating all airports, outbound business jet travel is up 14% compared to 4 years ago, in contrast to airline connections, which are trending down by 17% this year versus 2019. For example, business jet flights from London to Zurich this year are up 44% compared to 2019, with the same connection is served by 22% fewer scheduled flights so far this year versus 4 years ago.
Chart 4: Business Jets vs Scheduled Airline city pairs, outbound London to Europe, 1st � 18th June 2023 vs 2019.
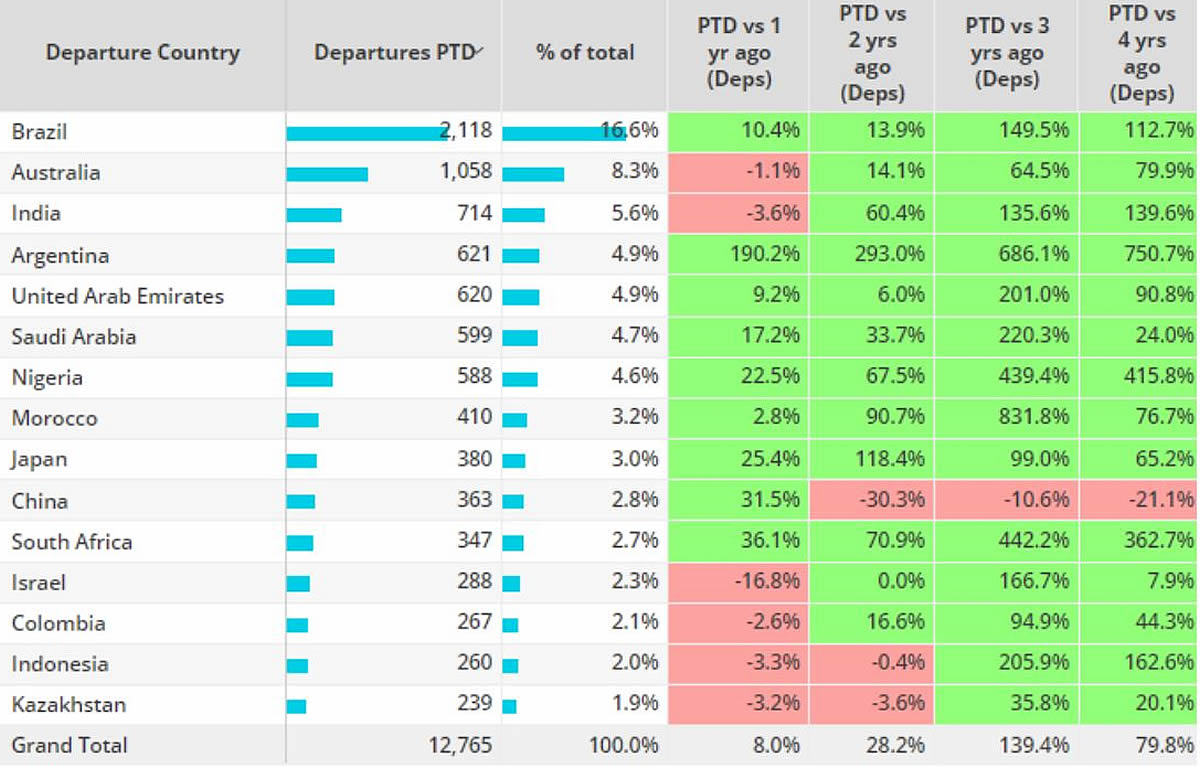
Rest of World
Outside of North America and Europe, business jet sectors this month are trending 8% ahead of June 2022, with Brazil the busiest market, 10% more sectors flown than last year. Australia and India complete the top 3 markets, activity down 1% and 4% compared to last year. Departures from China are 32% ahead of June last year, lagging 21% behind levels from 4 years ago. In the Middle East, business jet activity in week 24 fell 9% compared to the previous week, 1% below the same dates in 2022. Super Midsize Jets and Bizliners are the only aircraft segments in the ROW region to see demand fall behind last year, -5% and -1% respectively. Ultra-long-range jets are the busiest aircraft segment in ROW this month, departures are 14% ahead of last year, 35% ahead of 2019.
Chart 5: Rest of World Aircraft Countries June 1st � 18th 2023 compared to previous years.