WINGX�s weekly Business Aviation Bulletin.
Summary
Globally, the gap between 2023 and 2022 is closing as we have now passed the anniversary of the post Covid peaks in bizjet activity. Growth on 2019 is still substantial but there are regional exceptions. California saw a 19% drop in year-on-year bizjet activity this week with levels below 2019. In Europe, bizjet activity in Russia, Germany and Austria is trending behind 2019 levels this year
Global
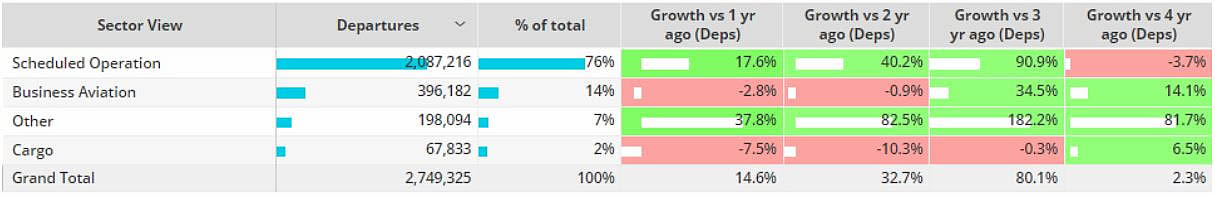
Twenty-seven days into August 2023, global business jet and turboprop sectors are down 3% compared to the same period last year, still 14% ahead of August 4 years ago. Comparatively, Scheduled Airline activity is 18% ahead of last year, 4% short of August 2019. The top 5 commercial airlines (Southwest, American, Delta, Ryanair & United Airlines) are flying 11% ahead of August 2022, 8% ahead of 2019. Global cargo activity is 8% down on last year, 7% up on 2019. Focussing on just business jet activity, global sectors are 4% behind August 2022, 17% ahead of August 2019.
Chart 1: Global fixed wing flights by sector, August 2023 compared to previous years.�(Note business aviation includes turboprops)
Europe
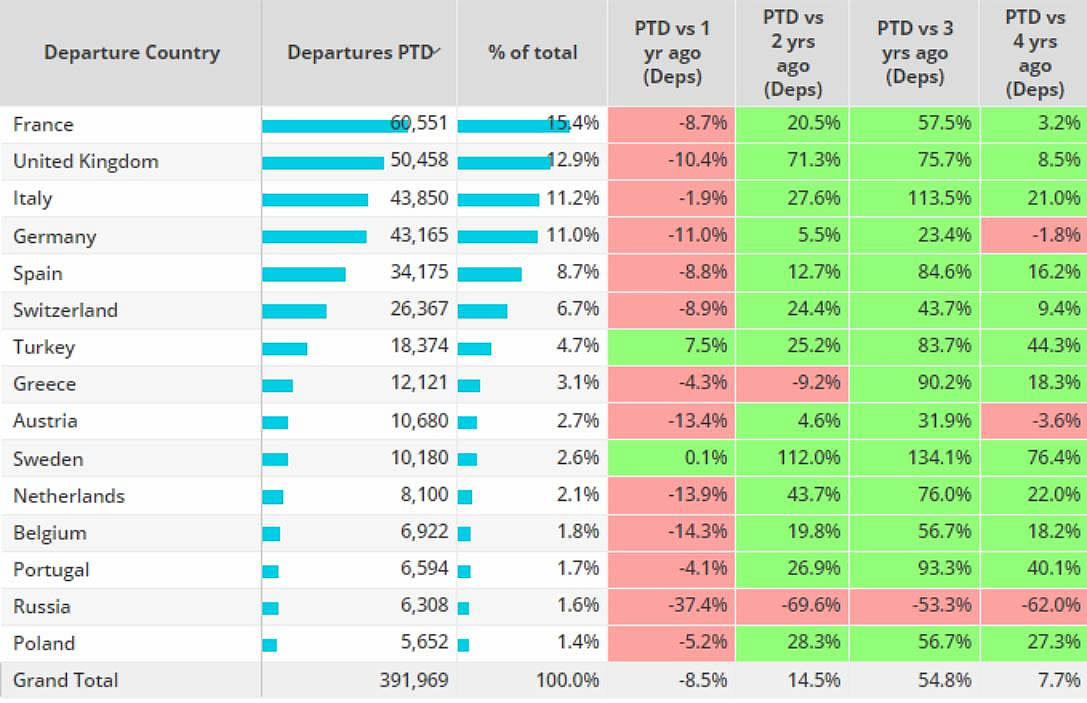
In Week 34 (ending 27th August), European business jet activity grew 8% compared to the previous week, down 7% compared to the same dates in 2022. Year-to-date (1st January – 27th August), business jet activity in Europe has fallen 9% behind 2022, still 8% ahead of the first 8 months of 2019. Scheduled airline activity has rebounded 12% compared to last year, 16% behind pre-pandemic 2019. France is the busiest bizjet market YTD, activity 9% ahead of last year, 3% ahead of 2019. Business jet activity in Russia has fallen 62% compared to 2019. The other two countries with activity fading on 2019 are Germany, flight down 2% and Austria 4% behind 2019.
Chart 2: European Business Jet activity 1st January � 27th August 2023 vs previous years.
North America
In Week 34 North American business jet activity fell 4% compared to the previous week, trending 5% behind the same dates in 2022. Year-to-date 2023 there have been 1.8 million business jet sectors operated in the region, 6% fewer than last year, 18% more than in 2019. Scheduled airline activity over the same period has rebounded 7% compared to last year, although still 8% behind 2019. In the United States, representing 91% of regional bizjet sectors, departures are running 6% behind last year, 16% ahead of 2019. Bizjet activity in Mexico and Canada is up 3% on last year.
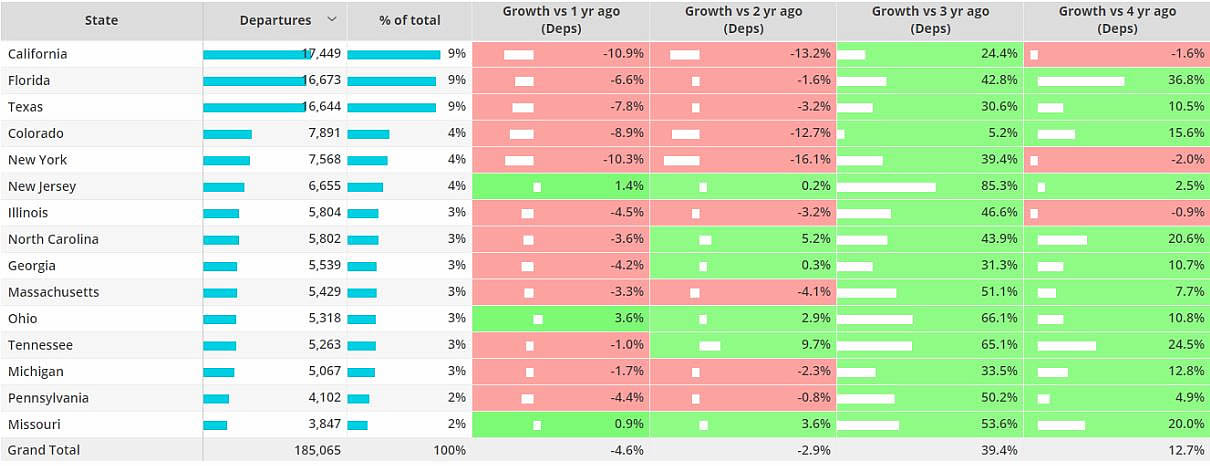
Within the US, bizjet traffic in California has seen a 19% dip in the last week and is trending 11% down so far this month, actually 2% below comparable 2019 levels. Both New York and Illinois are also seeing bizjet activity below comparable August 2019. In contrast, Colorado, Texas and especially Florida are still well ahead of 2019 levels, though down from last year’s peaks.
Chart 3: US Business Jet activity by State, August 2023 vs previous years.
Asia
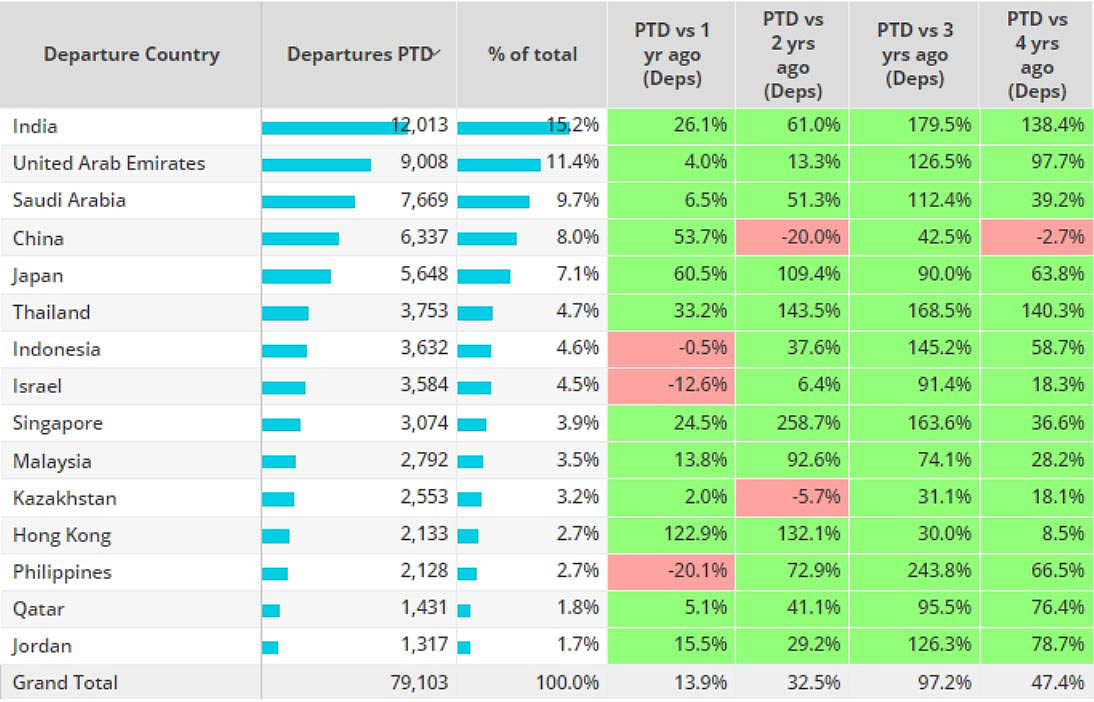
Year to date business jet activity in Asia has grown 14% compared to the same period last year, is trending 47% ahead of 2019. Top market India is seeing 26% growth compared to last year, whereas the UAE, which has doubled activity compared to 2019, is only up 4% this year compared to last year. Bizjet activity in China has rebounded 54% compared to locked-down 2022 but is still trailing 2019 activity by 3%.
Chart 4: Bizjet activity in Asia 2023 Jan-Aug 2023 vs previous years
Middle East
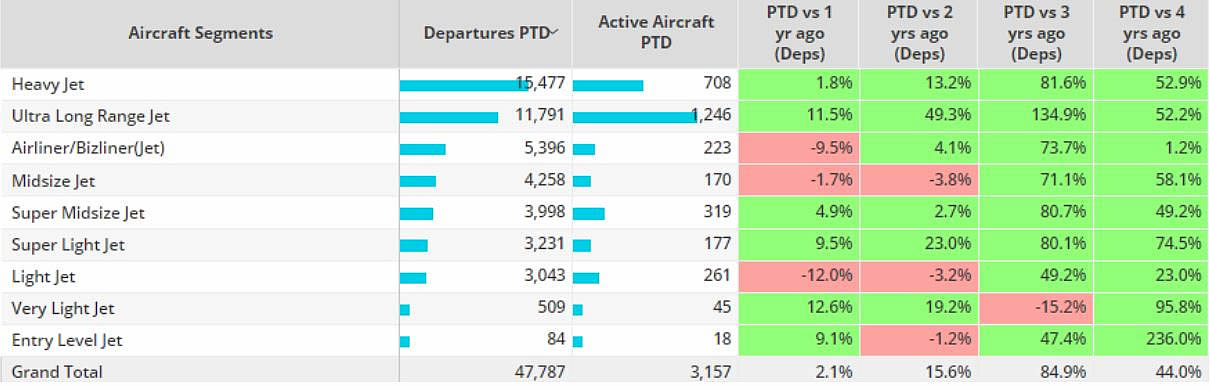
So far this year activity in the Middle East is 2% ahead of 2022, 44% ahead of 2019. Activity across the main markets is mixed, Israel -13% compared to last year, Bahrain -23% compared to last year, Kuwait seeing 77% declines compared to last year. Demand is being driven by heavy jets this year, almost 16,000 sectors flown on heavy jets in the region since January 1st, 2% more than 2022. Bizliners are 10% behind last year, although 1% ahead of 2019. Light jets are seeing double digit declines compared to 2022, entry level jets triple digit growth compared to 2019.
Chart 5: Bizjet activity in Middle East by aircraft segments