
The summer peak may be about to fade from memory, but the demand trends we�ve seen are still a hot topic. And as we gear up for the fall, Harry Clarke, Head of Insights and Analytics, Avinode, shares interesting sourcing patterns and trends related to upcoming events across the USA, Europe and the rest of the world.
European demand trends are changing
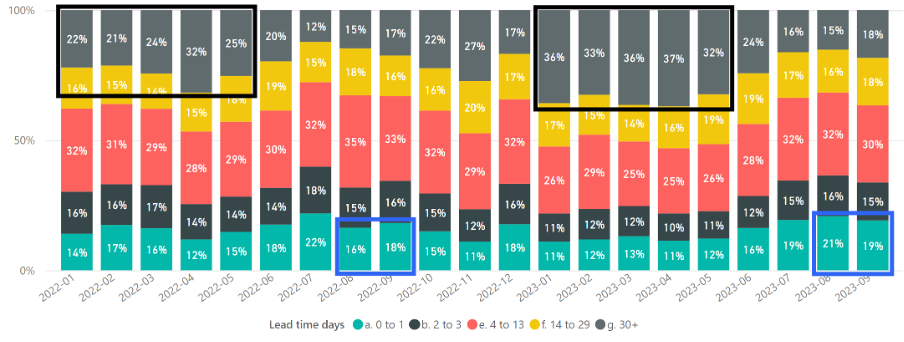
The chart above outlines how far in advance buyers have been sourcing charter, broken down into groupings of days in advance. We see a significant change between the first half of 2022 and 2023. In 2022, about 25% of requests were for trips greater than 30 days in advance. The equivalent in 2023 was about 35%.
That change meant that in summer 2023, demand accumulated earlier. In August and September so far, we have seen an increase in the amount of last-minute demand, compared to 2022.
 �
�
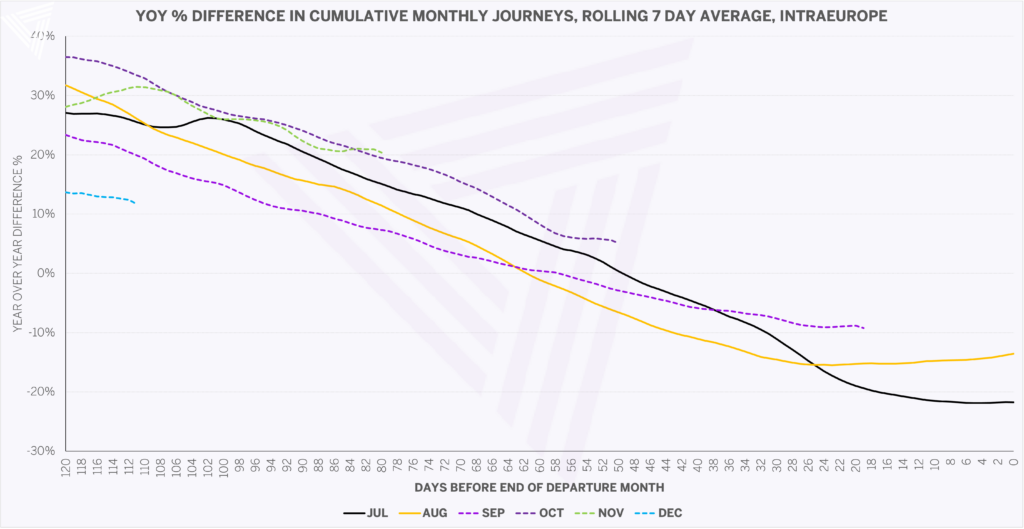
Year-over-year difference in cumulative demand, 7-day average, for trips within Europe.
This chart shows the forward demand trends for the fall months in the European market, along with the completed figures for July and August.
You can see the impact of the change in sourcing behaviour in this chart. All the departure months initially started performing well versus last year before steadily decreasing – because a higher proportion of sourcing happened early in 2023, compared to 2022. August did recover slightly in the late market, ending 14% down.
What will happen in the Fall?
We have continued to see demand accumulate earlier than 2021 and 2022. We expect future months to follow similar trends and end 5 to 15% down. Some trends over the next 12 weeks, starting mid-september, include:
- Demand between the UK and France, up 20% vs. 2022. It is clear the Rugby World Cup is driving this, with increased demand to and from venue cities like Marseille and Paris.
- Domestic flights in Spain, up 17%. Departures from Spain are up 6%.
- Departures from Germany, down 22%. Demand to Spain is resilient but domestics, and international demand to the UK, France, and Italy are all down on last year.
- Looking at demand between Europe and the Middle East for only the next 9 weeks (so that the figures aren’t clouded by the Qatar World Cup last year) � overall demand is flat. Strong demand between the UK, Dubai and Saudi Arabia is compensating for less demand elsewhere.
 �
�
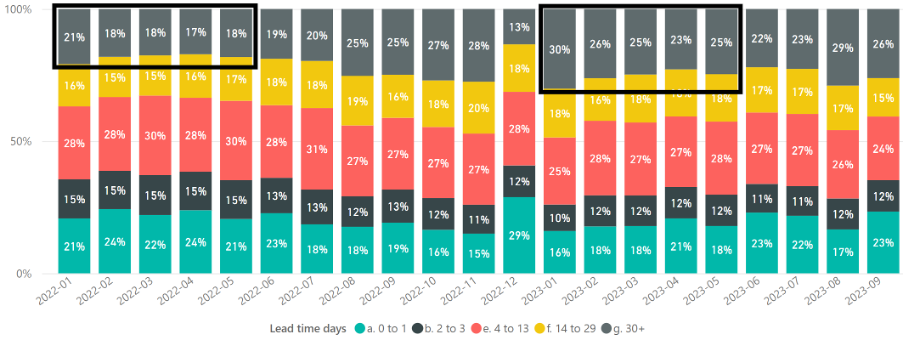
Distribution of how far in advance trips were sourced by sourced month, for US buyers.
Sourcing behavior in the US shows a similar trend to Europe with much higher advance sourcing during the first half of 2023 than in 2022. Even in August 2023, the figure was 4 percentage points higher than in 2022.�
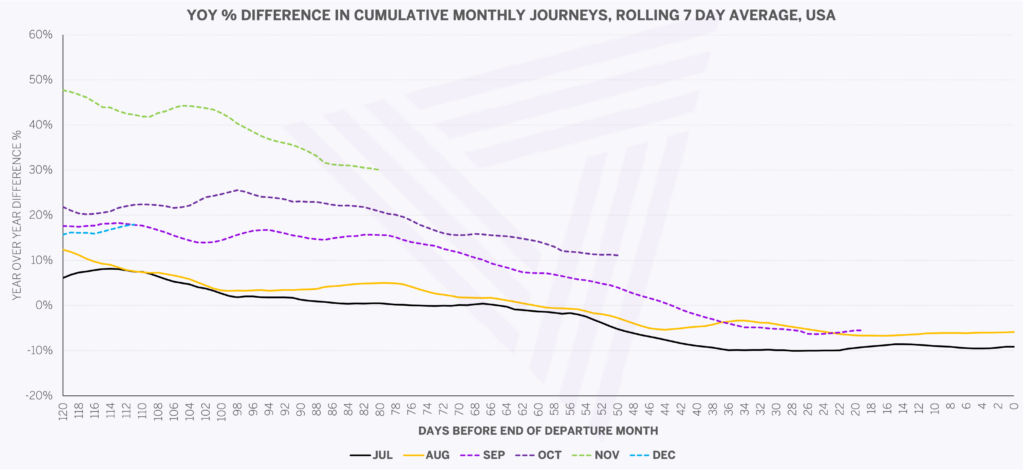
Year-over-year difference in cumulative demand, 7-day average, for US domestic trips.
The impact is shown in the build-up of demand for future months in the US � with demand for September and October at around 20% above 2022 early on, before decreasing closer to departure. I expect September to finish similarly to August, which closed at 6% down. October looks more positive and could finish better than September. November will decrease from its high position, which is caused by very early demand for this year�s Thanksgiving celebrations.
Looking more granularly, for the next 12 weeks from mid-September:
- Demand from the Western states is up 6%, driven by flights to and from Las Vegas. From across the US, demand into Vegas is up 25%. This is concentrated around the F1 Grand Prix weekend. The demand increase is highest from California, but Florida, New Jersey and Illinois are also contributing.
- Demand between New Jersey and Florida is down around 20%. Miami and Orlando are the arrivals driving this, with more robust demand to West Palm Beach and Fort Lauderdale.
- Notable increase in demand to and from Atlanta � so far about 35% up on 2022 for this period.
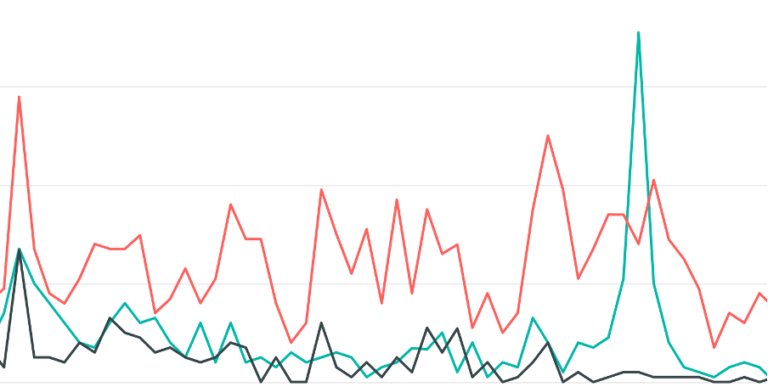
Demand into Las Vegas, by, day, from within the USA: October and November. Note the big demand spike for the Las Vegas F1 Grand Prix on the right-hand side. Green = demand so far this year, red = final demand last year and black = last year demand at the same number of days before departure.
For travel within Latin America, demand in Avinode is so far up 16% for the next 12 weeks, with the domestic Mexican market contributing the most to this increase. Cross-border traffic between Mexico and the US is down around 10%. In the Caribbean, the star performer is the Dominican Republic, with demand from the US up 33%.
Transatlantic travel is flat. Elsewhere in the world, demand from Asia is notable, with trips to the US and Europe up around 25%. Ranking the top 50 countries for departures over the next 12 weeks, those displaying the highest percentage growth versus last year are China (up 200%) and Japan (49%).