Business jet activity ticked up this week compared to last week, as the US market emerged from the winter storms. So far this year, US bizjet is trending down 6% compared to January 2023, but is still tracking well up on pre-pandemic January 2019. Europe is a different case, with several countries seeing less traffic this January than in January 5 years ago.
Global
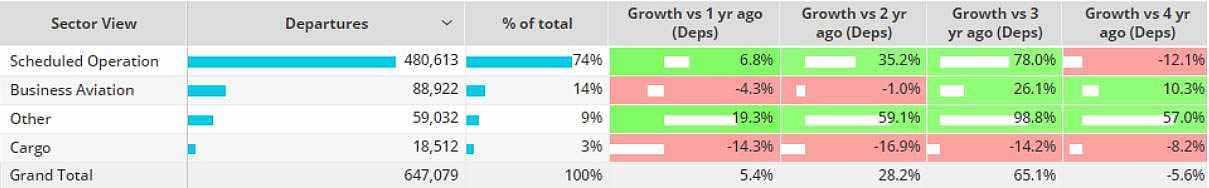
Global business jet activity so far this year (January 1st – 21st) is currently 5% behind last year, 18% ahead of comparable January 2019. Week 3 of 2024 (January 15th � 21st) saw global business jet traffic grow 3% compared to the previous week, 5% fewer flights than during the same dates in January 2023. Part135 & Part91K bizjet activity grew 3% compared to Week 2, 3% behind Week 3 in 2023. Worldwide scheduled airline sectors in Week 3 2024 were 7% ahead of the same dates last year, cargo sectors fell 14% behind the same dates in 2023.�
Chart 1: Week 3 2024 activity by sector, compared to 2023, 2022, 2021, 2020.� (Business aviation includes turboprops and business jets)�
North America
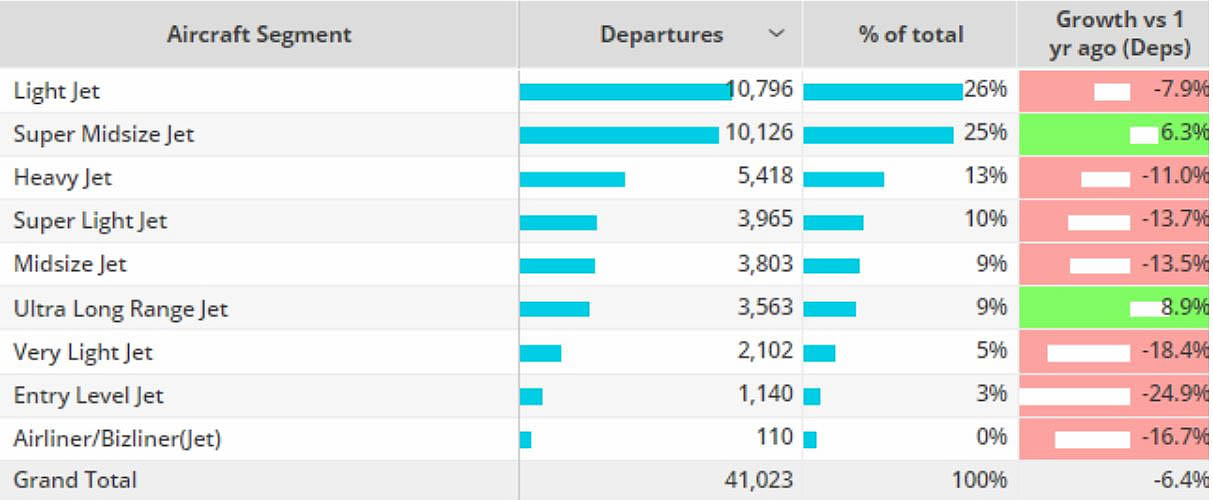
So far in January 2024, business jets in North America are flying 6% fewer flights than last year, 16% ahead of January 2019. In the United States, flight activity was down across all US States except New Jersey, from which outbound flight hours were up 2.2% compared to last year. Busiest US State Florida has seen activity drop 5% YOY. Nevada, Pennsylvania and Missouri have seen bizjet activity fall more than 10% compared to January last year. Bizjet activity in California is trending only 2% down on last year. Corporate flight departments edged out as the busiest operator type in the US in W3, although trending 19% below last year. Branded Charter activity fell 14%, contrast Fractional fleets flying 6% more than last year. Light jets flew the most flights in W3, beating second ranked Super Midsize by roughly 600 flights. Light jets are trending 8% behind last year, Super Midsize and Ultra Long Range jets flying 6% and 9% more than last year respectively.�
Chart 2: US Bizjet activity by operator type, W3 2024 vs 2023�
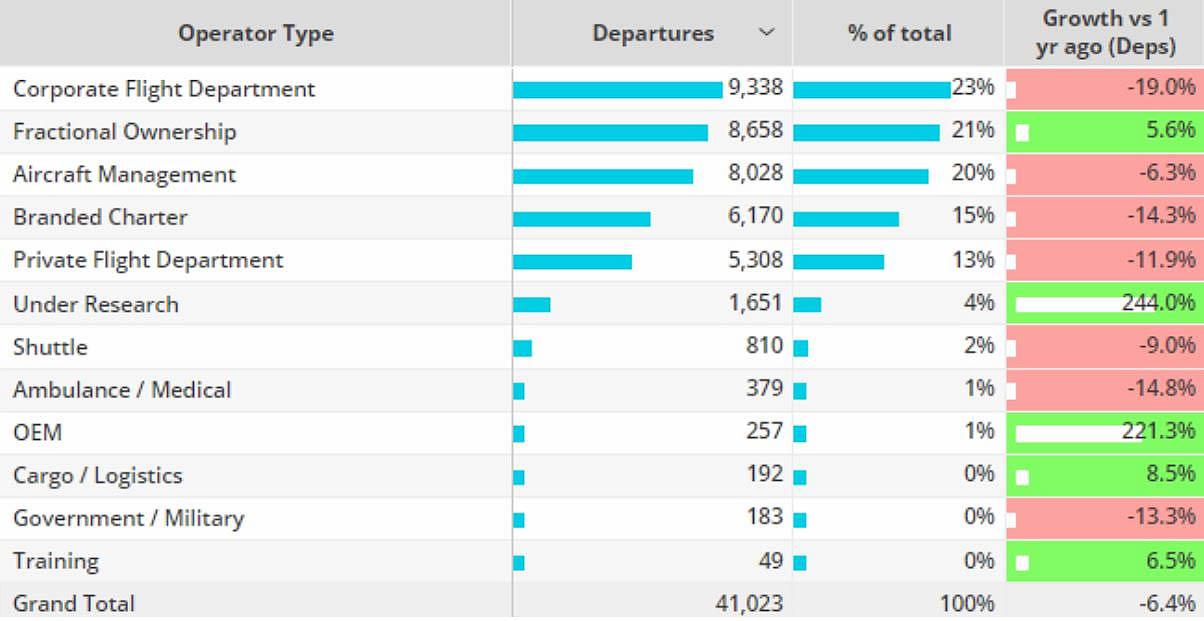
Chart 3: US bizjet activity by aircraft segment, W3 2024 vs last year.�
Europe
Through 21st January 2024, European bizjet activity is trending 3% behind last year, 5% ahead of comparable January 2019. The trend narrowed to 4% in Week 3 YOY. So far this year France, United Kingdom and Germany are the busiest bizjet markets across the region. Sectors in Germany are down 11% compared to last year, 13% behind January 2019. Similarly, France is behind both January last year and 2019, UK remains ahead of 2019 despite 3% declines versus last year.�
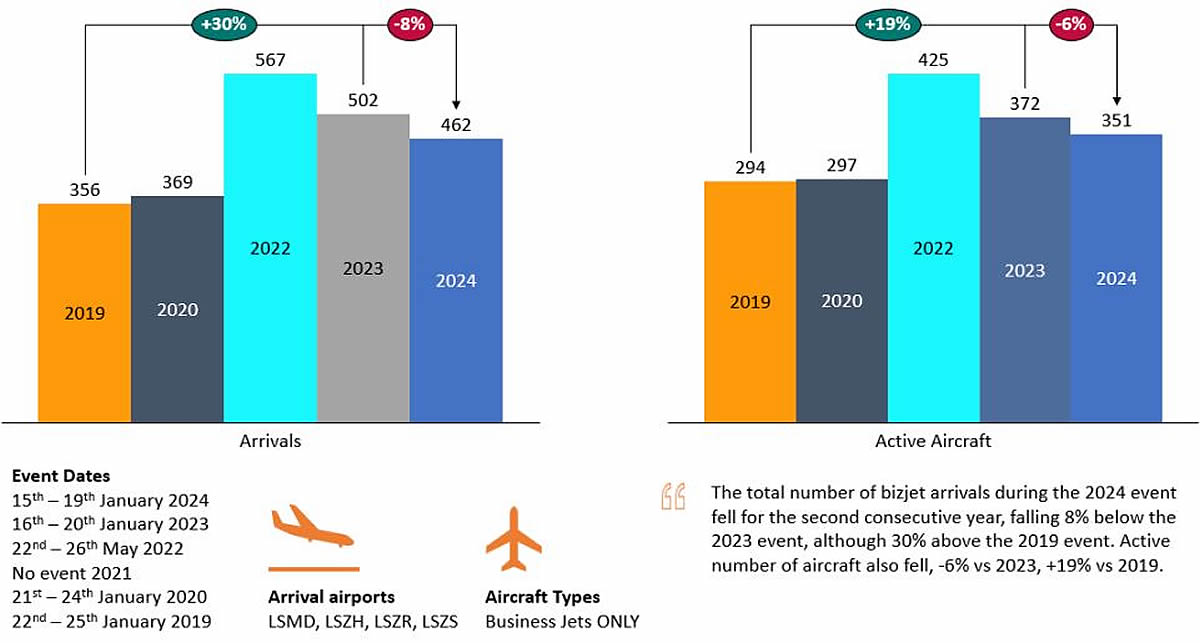
Airports near Davos (LSMD, LSZH, LSZR, LSZS) saw an influx of business jet arrivals during the week of the World Economic Forum event in Davos last week (15th � 19th January). 462 Bizjets arrived at airports near Davos during the event, trending for the second consecutive year. There were over 100 more aircraft arrivals compared to the 2019 event, however, the 2019 & 2020 events were only 4 days in length. This year, Germany was the top origin country for bizjets during the week, followed by France and the United Kingdom. Elsewhere, in Week 3, Le Bourget was 3% behind last year, contrast Nice and Ataturk, both 22% ahead of last year.�
Chart 4: European Bizjet airports, W3 2024 compared to last year.
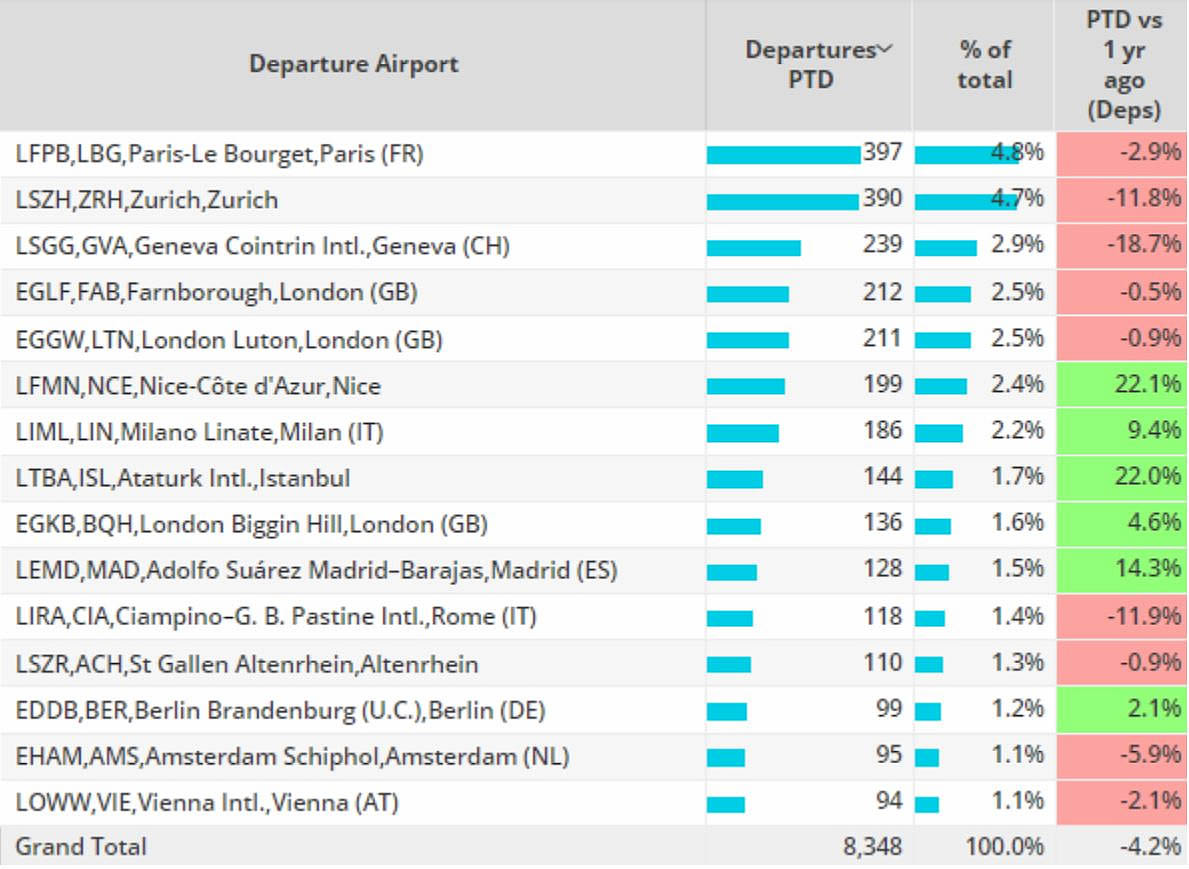
Chart 5: World Economic Forum Davos: 2024
Asia & Middle East
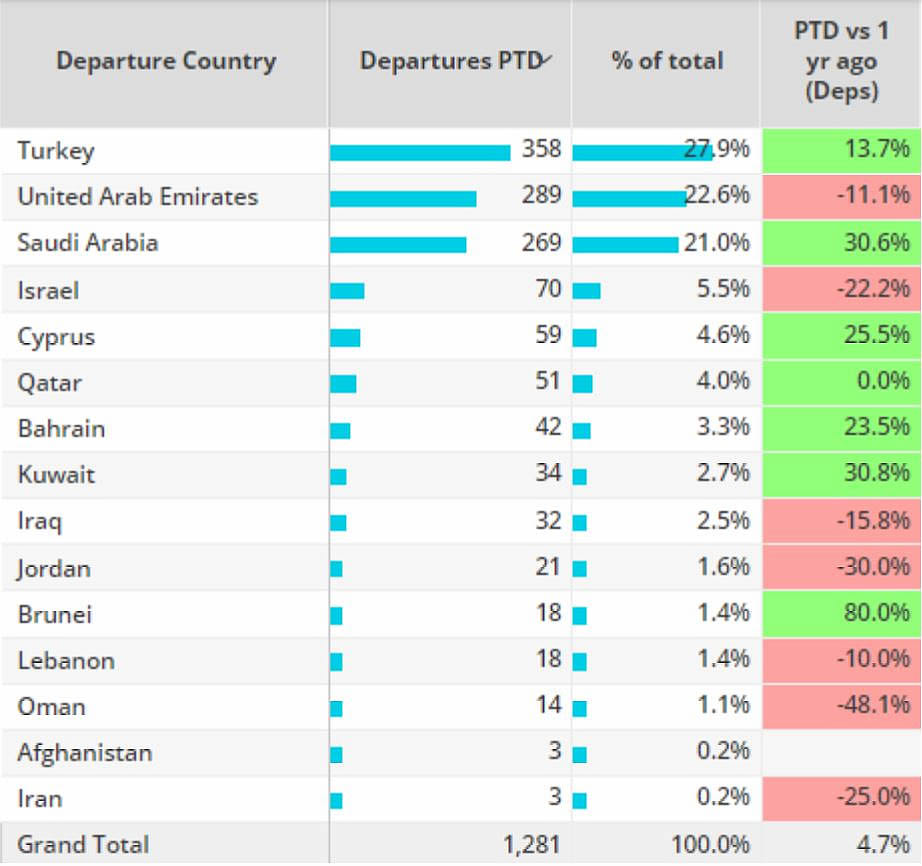
In Asia bizjet activity in Week 3 of 2024 is trending 1% below the same dates in 2023. Demand in the Middle East was up 5% ahead of the same dates in 2023. Heavy jets flew the most flights in the Middle East in W3, 1% less activity than during the same dates last year. From the UAE, bizjet activity is 11% below 2023. China saw 18% fewer flights in W3 2024 than the same dates in 2023. So far this month activity in Israel is 16% ahead of comparable 2019 but 24% down compared to last year. �
Chart 6: Middle East business jet countries, Week 3 2024 compared to the same dates in 2023.�