
Global bizjet trends are flat over the last 4 weeks, recovering from the dip at the start of the year. The most recent week showed a 3% increase in the US, with Part 135 activity out of Florida up 11%, but Canada continues to see steep declines. Europe is flat, extending a 3% decline over the last month.
Global�
For Week 8, through 25th February, global business jet activity was up 2% YOY, compared to week 8 2023. 73,513 business jet sectors were flown in the last week, 3% ahead of the previous week. So far this year (1st January – 25th February), global business jet and turboprop activity is down 2% compared to last year. During the same period, scheduled airline sectors are trending 7% ahead of 2023. Cargo sectors are dipping 4% behind comparable 2023.
Chart 1: 1st January � 25th February activity by sector, compared to previous years (Business aviation includes business jets & turboprops)��
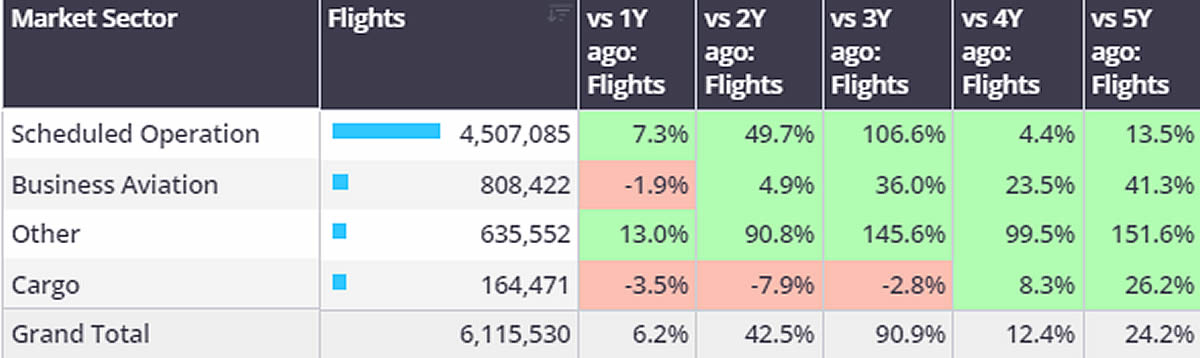
*WINGX added new sources for global flight data in Feb-24, backdated to Jan-23, which has modestly inflated ROW trends vs 2019.
United States�
51,480 business jet sectors were flown in Week 8 in the United States, 3% more than the previous week, 3% ahead of Week 8 in 2023. The last 4-week trend for the US is 1% ahead of the same period last year.�
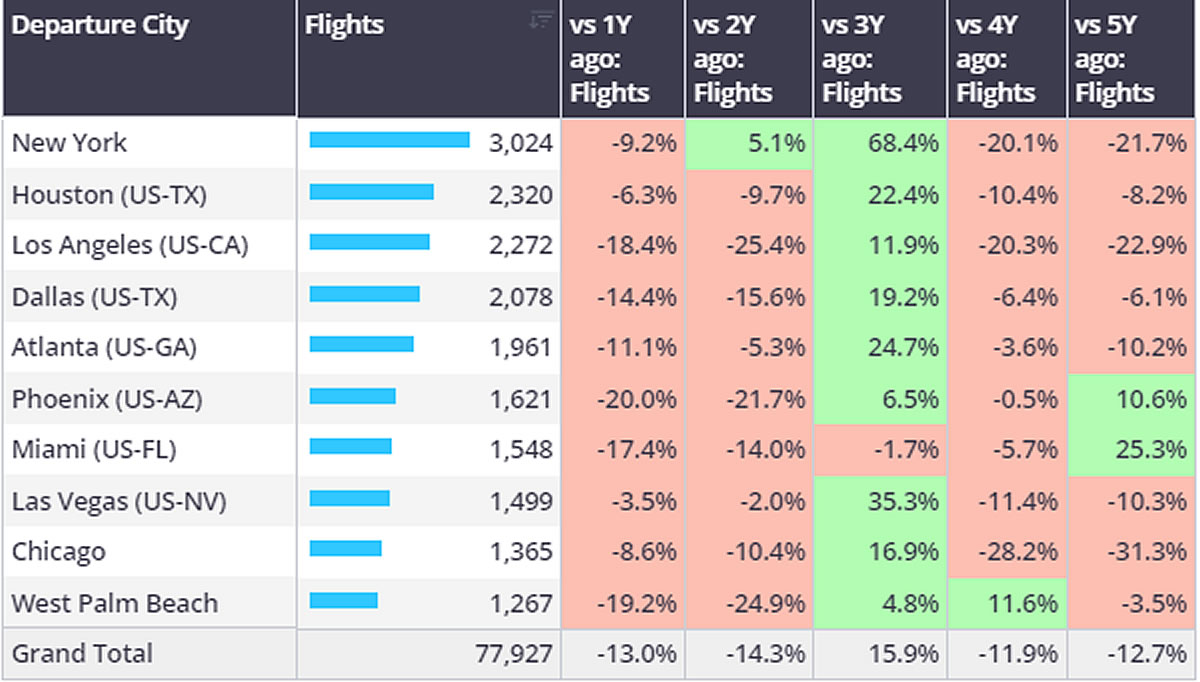
Year to date (1st January � 25th February, 2024), US bizjet sectors have fallen 2% behind comparable last year. Despite being the busiest operator type, corporate flight department fleets are flying 13% less than pre-pandemic 2019. Fractional programmes, however, are busier than each of the last 5 years. Florida is the busiest departure state for fractional fleets, flights 7% ahead of last year, 82% ahead of 2019. Florida is also the busiest departure state for corporate flight departments; however, flights are 12% down YoY. Corporate fleets are flying 23% less in California compared to 5 years ago.�
Chart 2: US Corporate Flight Department bizjet departures by city, 1st January � 25th February 2024 compared to previous years.�
Europe
In Week 8, European business jet activity was 2% behind the previous week, on par with Week 8 in 2023. The last four-week trend is trending 3% below the same four weeks last year.�
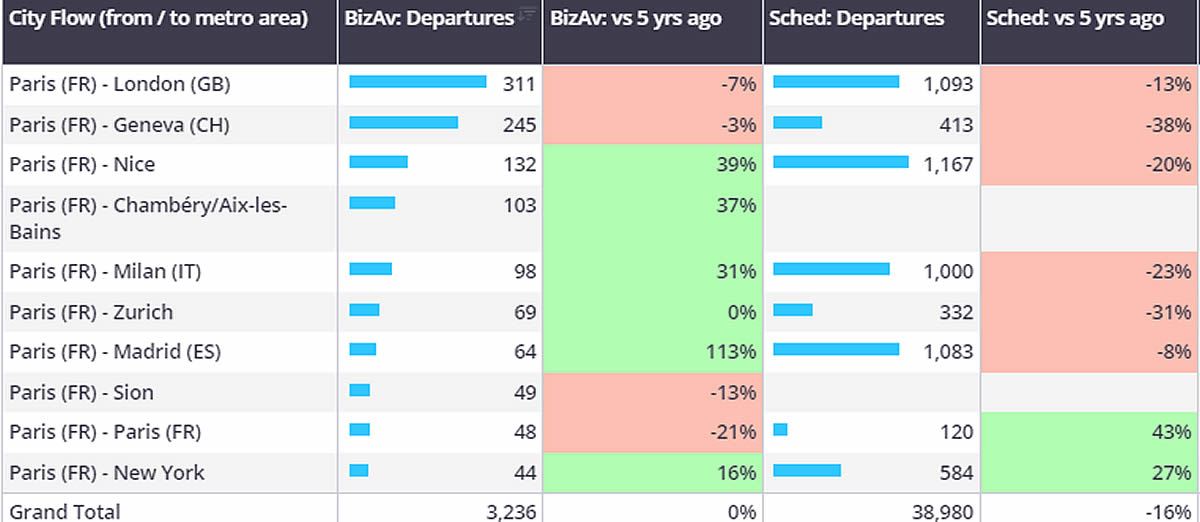
So far this year, business jet activity in Europe is just 2% ahead of comparable 2019, whilst scheduled airline sectors are 17% below comparable 2019. Europe’s busiest bizjet market, France, has seen 19% fewer scheduled airline sectors this year compared to 2019. Broadly speaking, the French bizjet market has seen the largest gains vs 2019 on city pairs with the largest declines in scheduled activity vs 2019. Paris-Nice for example is seeing 39% more bizjet flights than 2019, whereas scheduled airline sectors on the same city pair are down 20% compared to 2019. Elsewhere bizjets on the Paris � Milan route are up 31% vs 2019, scheduled airlines down 23% vs 2019.�
Elsewhere across Europe light jets are flying the most so far this year, followed by the super light category. The Embraer Phenom 300 is the busiest light jet in Europe this year, flights 4% ahead of the second ranked Citation CJ2. Light Jets are busiest in Germany, although activity has slipped 7% behind comparable last year. Munich is the busiest departure city in Germany, branded charter the busiest operator type.�
Chart 3: Business jet vs Scheduled airlines, departures from Paris airports, 1st January � 25th February 2024.�
Rest of World
Business jet activity in the Middle East in the last four weeks has fallen 11% compared to the same dates last year. In Week 8 activity was 6% behind Week 8 in 2023. Bahrain International Airport (OBBI) could benefit from the hosting of the F1 Grand Prix this weekend (29th Feb � 2nd March), arrivals into OBBI so far this year are 21% ahead of comparable last year. During last year�s Grand Prix 52 bizjet arrivals were recorded at OBBI on the Friday � Sunday GP weekend. Elsewhere, Canada, Bahamas and China are seeing bizjet sectors dip 2%, 3% and 19% respectively compared to the same period in 2023.�