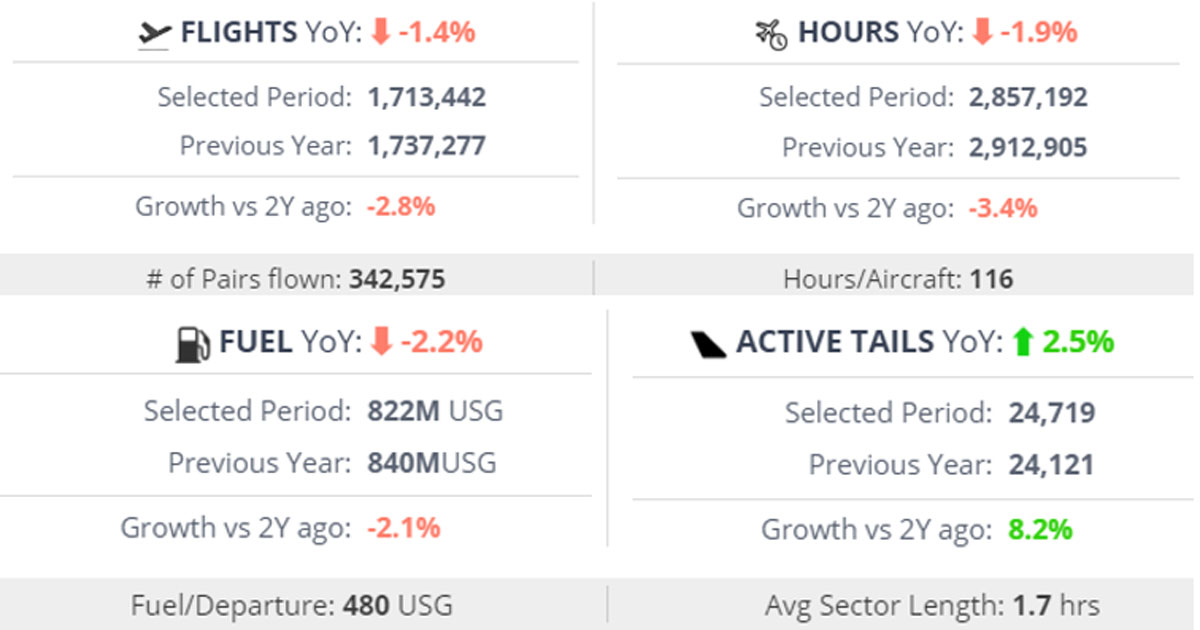
In Week 25 (17th � 23rd June), total global business jet activity measured by number of sectors flown fell 4% compared to Week 25 in 2023, compared to the last 4-week trend of 2% decline. Part 135 & 91K bizjet activity in week 25 fell 3% compared to last year. Year to date 2024, bizjet sectors have fallen 1.4% compared to last year, with flight hours falling 1.9% behind. Respectively for sectors and hours flown, the market is 2.8% and 3.4% behind comparable 2022. The active bizjet fleet this year is 2.5% larger than in 2023, up 8% on 2022.
Chart 1: Global bizjet overview, 1st January – 23rd June 2024
United States
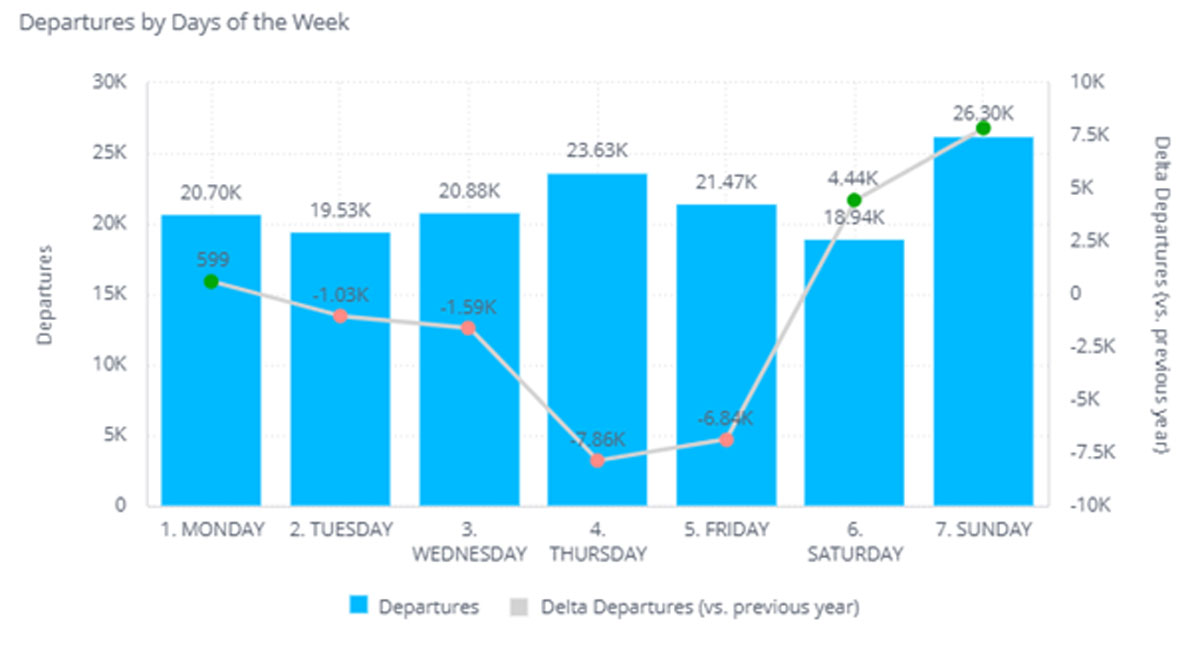
In the United States, bizjet activity in Week 25 fell 4% behind Week 25 in 2023. Part135 & 91K sectors dropping just 1% year on year; most of the decline came in Part 91 flights, with corporate flight departments flying less YOY. The largest declines in Week 25 were registered in Texas, -12% YOY, and California, -9% YOY. Across the whole US, there is a clear divergence in trends by weekday.� US bizjet activity is seeing the strongest year on year gains on weekends, Sunday’s being the busiest departure day across the entire week so far this month. The implication is that the leisure market remains very robust, with the corporate sector still relatively weak.
Chart 2: US Bizjets departures weekday analysis, 1st � 23rd June 2024
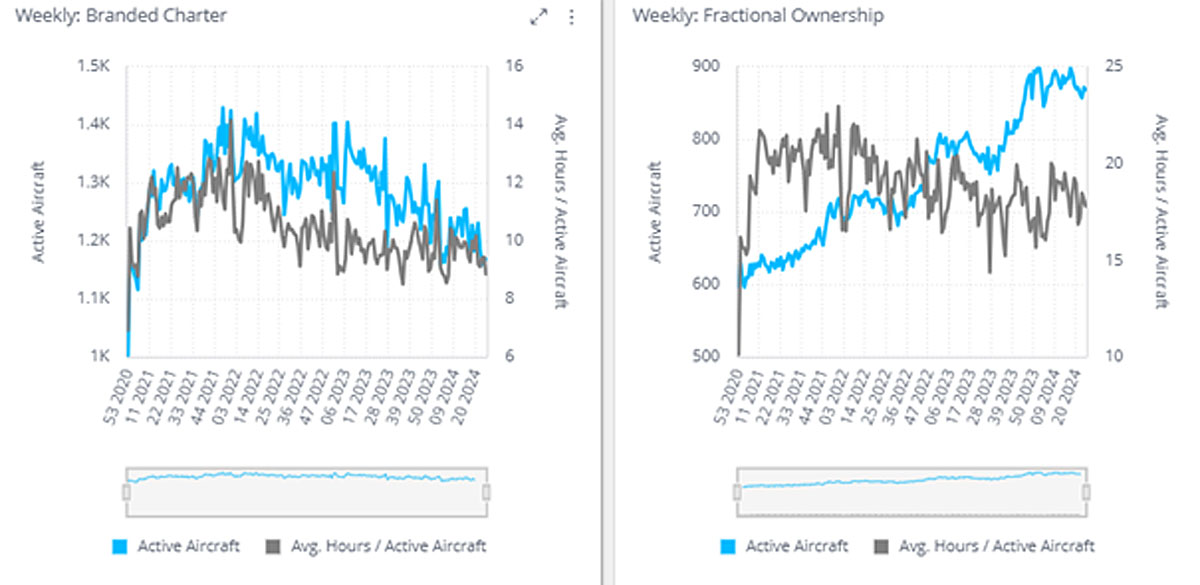
Fractional operators are continuing to see robust growth in the US market, YOY growth reaching 14% as June comes to an end. NetJets and FlexJet dominate the Fractional US market, responsible for over 31,000 of the 34,000 Fractional bizjet departures this month.� Other notable operators such as Airsprint and Volato have seen large gains on last year, 35% and 32% ahead of June 2023 respectively. As shown in Chart 3, the Fractional Operators have significantly increased their fleets since 2023, with utilisation per unit not yet correlating. In contrast, Branded Charter fleets have declined in active size, with hours per unit relatively stable.
Chart 3: US Branded Charter & Fractional bizjet utilisation, 1st January 2021 through 23rd June 2024.
Europe
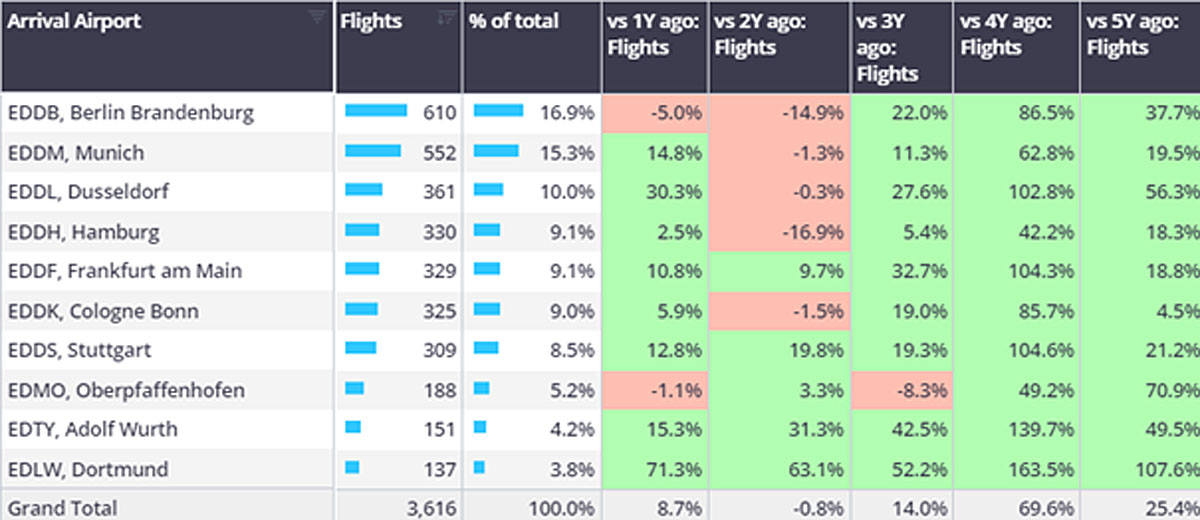
In Week 25 European bizjet activity measured by sectors flown was 2% behind the Week 25 last year, matching the month to date (1st � 23rd June) trend. Bizjet activity in UK and France, the two largest market, is ebbing on volumes in the last 3 years. Bizjet activity in Germany had fallen 10% below 2019 levels in the first 5 months of this year, but has been boosted by the UEFA EURO tournament which is being hosted in-country. Across the country, bizjet activity is up 3% this month, and up 9% in Week 25 compared to W25 in 2023. AOC activity bounced up by 13%. There have been particularly strong spikes in bizav usage at airports serving cities which are hosting group games, notably Dusseldorf (EDDL), Dortmund (EDLW) and Leipzig/Halle (EDDP). Almost a third of arrivals into Dusseldorf this month have been from other airports in Germany, over 100% YoY growth of arrivals from the UK, likely driven by England�s game against Serbia in nearby Gelsenkirchen.
�Chart 4: Business jet arrivals into airports near UEFA EURO Football Tournament stadia, June 1st � 23rd 2024 vs previous years.
Rest of World
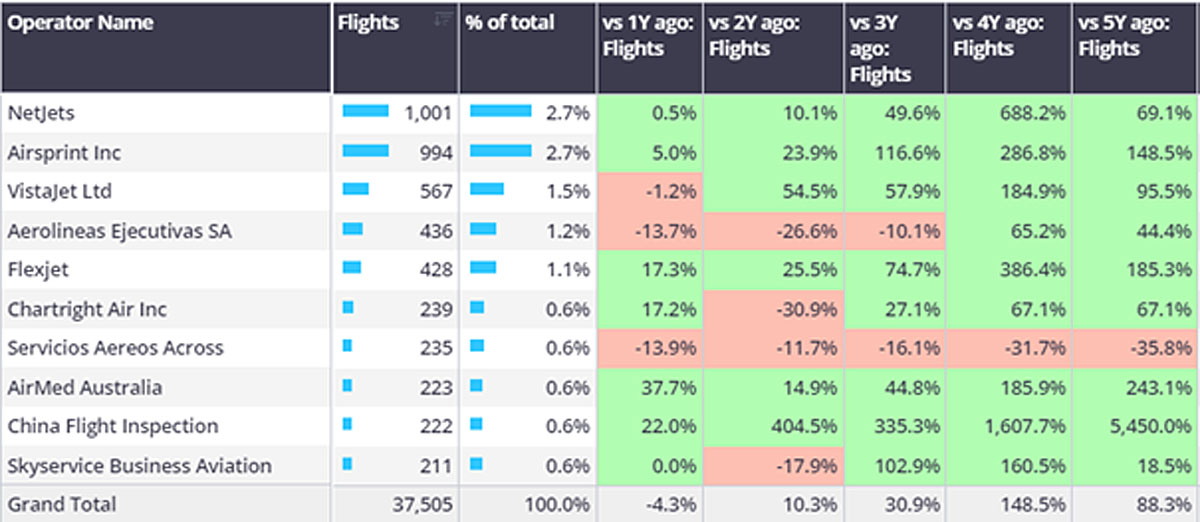
South America continues to see YOY growth in business jet flights, with Sao Paolo flight departures up 15% YOY. Whereas in other regions, bizjet activity is muted in week 25: bizjet flights from airports in Africa fell 13% YOY this week and is trending down by 21% in the last 4 weeks. Airports in Asia saw a 12% drop in YOY activity, widening the last 4-week trend of -4%. The largest declines are apparent in the Middle East, with Week 25 seeing a 26% fall off in bizjet activity.
Chart 5: Business jet operators by departures in all regions apart from US and Europe, June 2024