The first half of 2024 shows bizjet utilisation tapering slightly on 2023 but still well up on 2019. The US market is just 1% weaker than last year, with Florida, super midsize jets, and Fractional ops looking robust. European bizjet demand is strengthening this summer, notably in Germany. The Middle East is seeing weaker bizjet usage this year, especially in Saudi.
Global
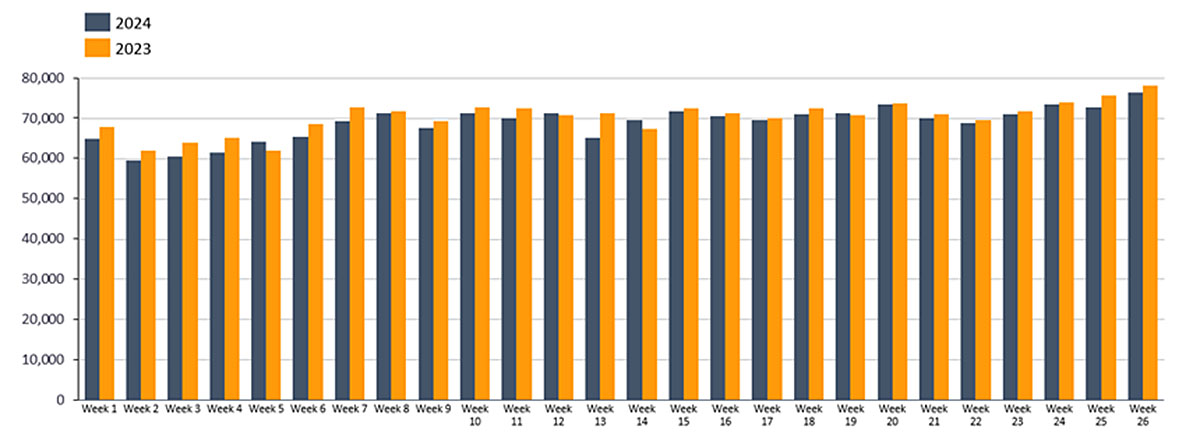
In Week 26 (24th – 30th June), total global business jet activity measured by number of sectors flown fell 2% compared to Week 26 in 2023, matching the last 4-week trend of 2% decline. Part 135 & 91K bizjet activity in Week 26 fell 5% below Week 26 in 2023. At the midpoint of this year (Week 1 through Week 26), bizjet activity has fallen 2% compared to W1 � W26 in 2023. From January 1st through June 30th the global bizjet fleet flew 2.98 million flight hours, 2% fewer than comparable 2023.
Chart 1: Global bizjet departures Week 1 � Week 26 2024 vs comparable 2023.
United States
In the United States, bizjet activity in Week 26 fell 3% behind Week 26 in 2023, the last four-week trend dipping 2% behind last year. Part135 & 91K sectors dropped 5% compared to Week 26 last year. Florida and California both saw activity dip 7% compared to Week 26 in 2023, Texas dropping 5% compared to Week 26 in 2023.
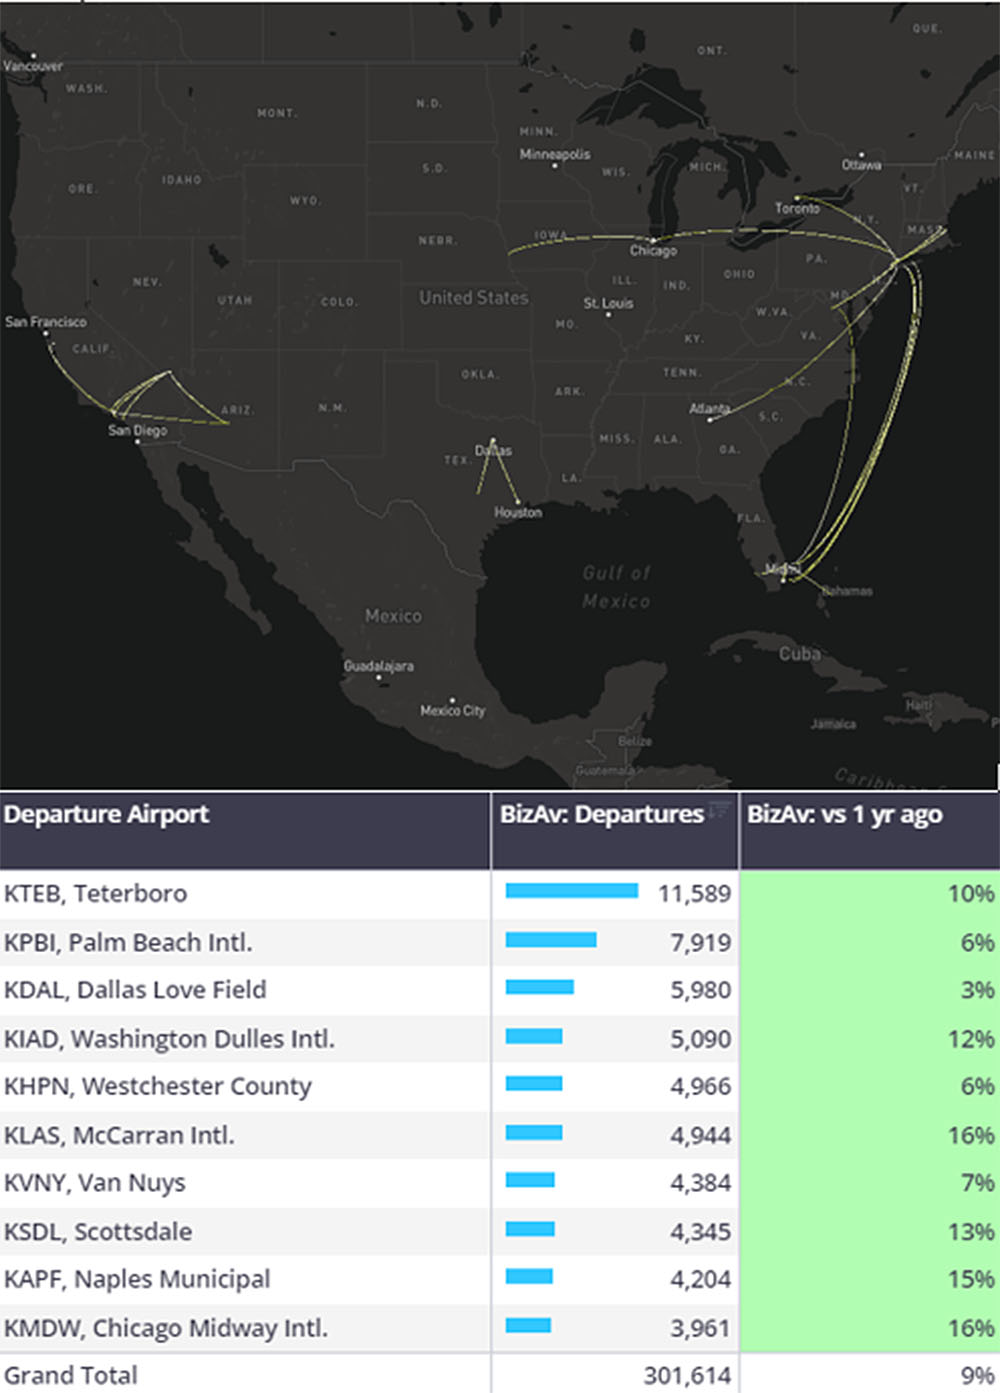
At the midpoint this year, business jet activity in the US has fallen 1% compared to last year, flight hours also falling 1%. Super Midsize and Ultra Long-Range jets are propping up the US market this year, departures up 9% and 6% respectively, flight hours matching these trends. So far this year 96% of Super Midsize activity in the US was N-reg (United States), however, across Ultra-Long Range Fleets N-reg activity represented 88% of flights, indicating a higher proportion of ULR flights by non-US operators. Super Midsize fleets also topped the utilisation rankings so far this year, recording an average of 147 hours per tail sign, significantly more than the average for all bizjet types which was 96 hours per tail sign in January through June.
Chart 2: US Super Midsize top 50 airport pair map and departure airports ranked by departures, 1st January � 30th June 2024.
Across the operator types, Aircraft Management fleets have flown the most bizjet flight hours YTD in US, closely followed by Fractional Fleets. Fractional Fleets flying more flight hours than any of the last 5 years.
Europe
In Week 26 European bizjet activity dropped 2% compared to Week 26 in 2023, the last 4-week trend 3% down compared to last year. Germany’s UEFA EURO boost continues, activity in Week 26 being lifted 6% compared to last year. In contrast, UK and France recorded declines compared to last year, sectors down 2% and 8% respectively.
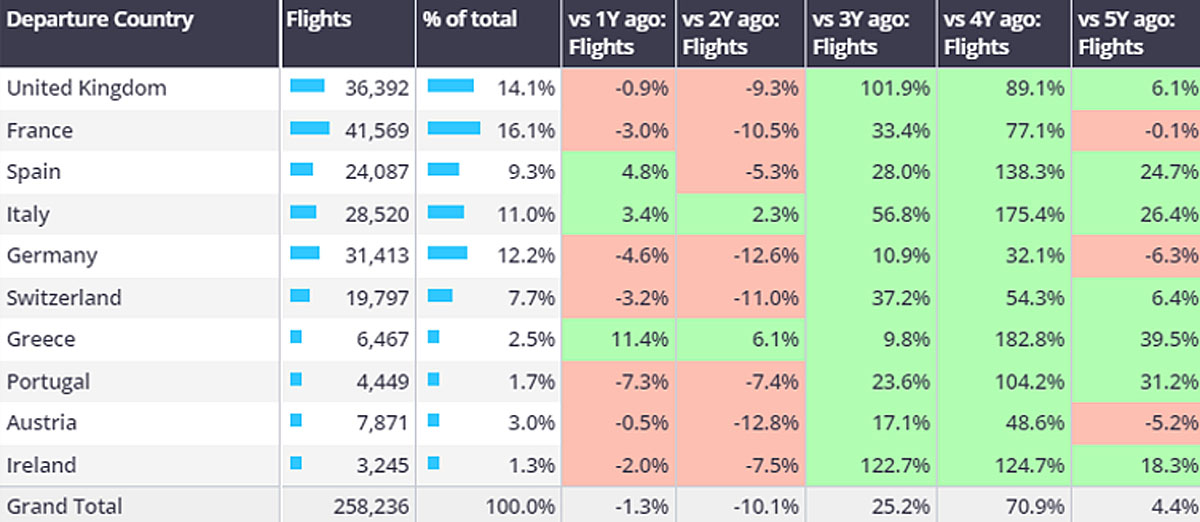
At the halfway point this year France is the busiest European bizjet market, although departures dropped 3% compared to last year. Italy and Spain buck the regional trend, 3% and 5% year on year growth respectively. Aircraft Management and Fractional fleets appear to be lifting the Italian market, departures up 3% and 11% respectively. Greece is also seeing strong growth, bizjet departures are 11% ahead of last year.
Elsewhere just 2,788 bizjet flights out of Russia at the halfway point this year, 37% fewer than last year, a sharp decline compared to the 12,261 flights in 2019. Domestic flights in Russia make up 41% of departures so far this year, top international connections are to Turkey and the United Arab Emirates. Bizjet flights from Europe to Israel are down 15% year on year, top connection is Greece to Israel, flights on the route up 34% compared to last year. Connections from the UK to Israel down 10%, France down 39% and Switzerland down 42%.
Chart 3: Business jet departures, top European markets, January � June 2024
Rest of World
Week 26 saw South America bizjet activity rise 5% above Week 26 in 2023, at the halfway point this year activity out of Sao Paolo is 13% ahead of last year. In the Middle East bizjet activity in Week 26 dropped 12% year on year, so far this year departures out of Riyadh are down 15%, Jeddah activity less than half of last year, the Middle East wide trend is 8% behind 2023.
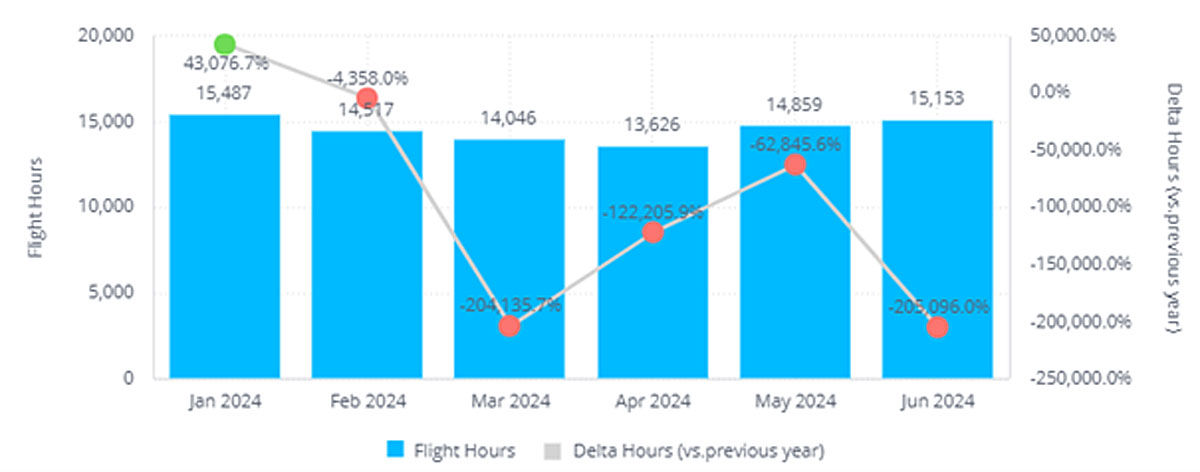
Chart 4: Business jet flight hours in Middle East region, January � June 2024